By: Doug Rosen
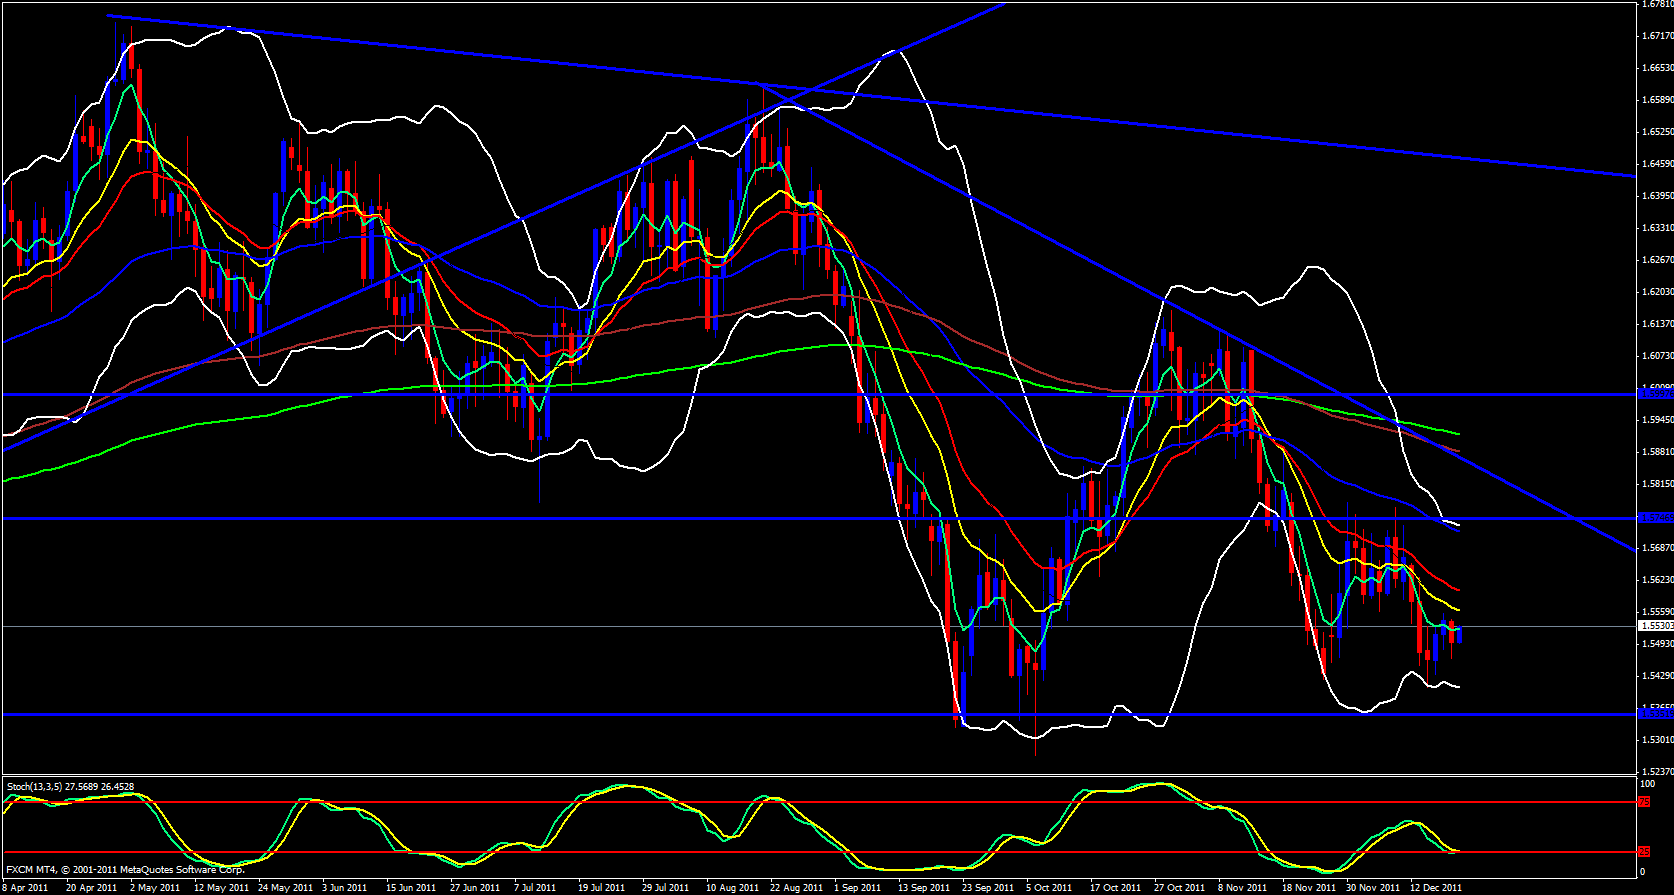
Of all the pairs I have analyzed tonight the GBP/USD seems to be the only pair that has been showing any signs of activity. It had an 80 pip range when some pairs barely had 60 or even 40 pip ranges. On the weekly time frame price is trying to reach up to the 5 ema. This pair has been making higher lows for the past couple days and on the daily time frame price is approaching the 13 ema with the 21 ema not far above that and a retracement to those ema's will also be a 50.0 - 61.8 fib retracement. I expect price to reach those ema's then probably continue to fall down, however we must remember that price is very close to strong visual support at around 1.5350 and I doubt with the recent lack of volatility in the market this week if price can break this support level if it reaches it and will more than likely bounce back up due to profit taking.
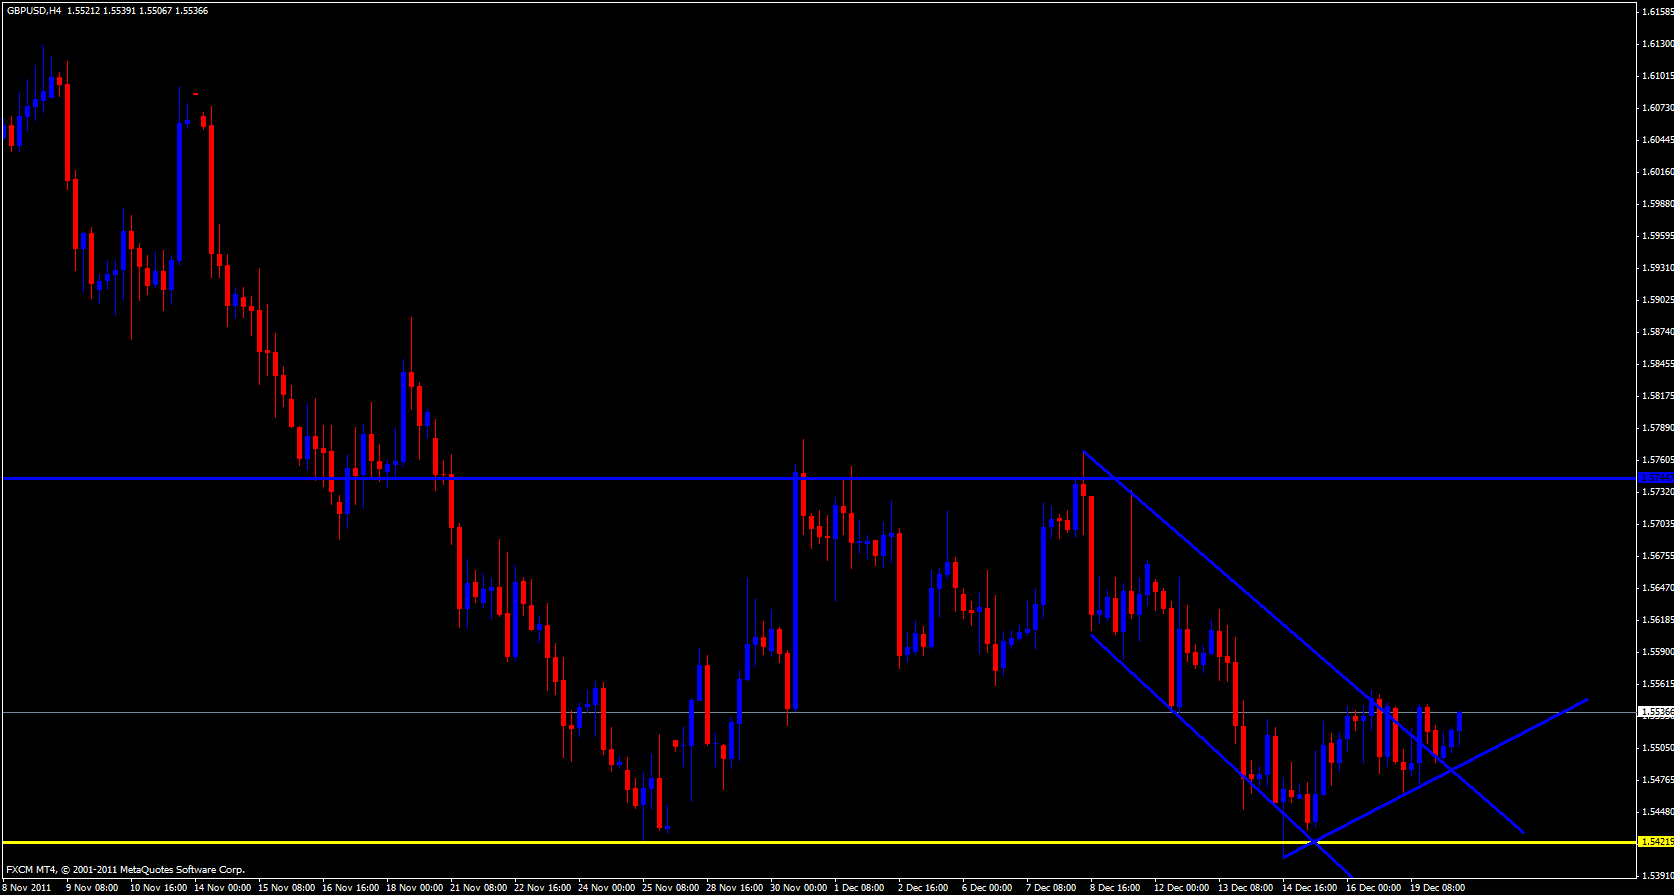
On the 4 hour time frame I have had price trapped within a price channel and it now seems like it is making a breakout to the upside. Still too early to tell, the breakout could be a fake but we have already had a few candle closes outside of this channel. This pair will still have to contend with the 4 hour 55 ema up above, normally a tough ema to break first time around and the monthly M2 is just above that at 1.5560
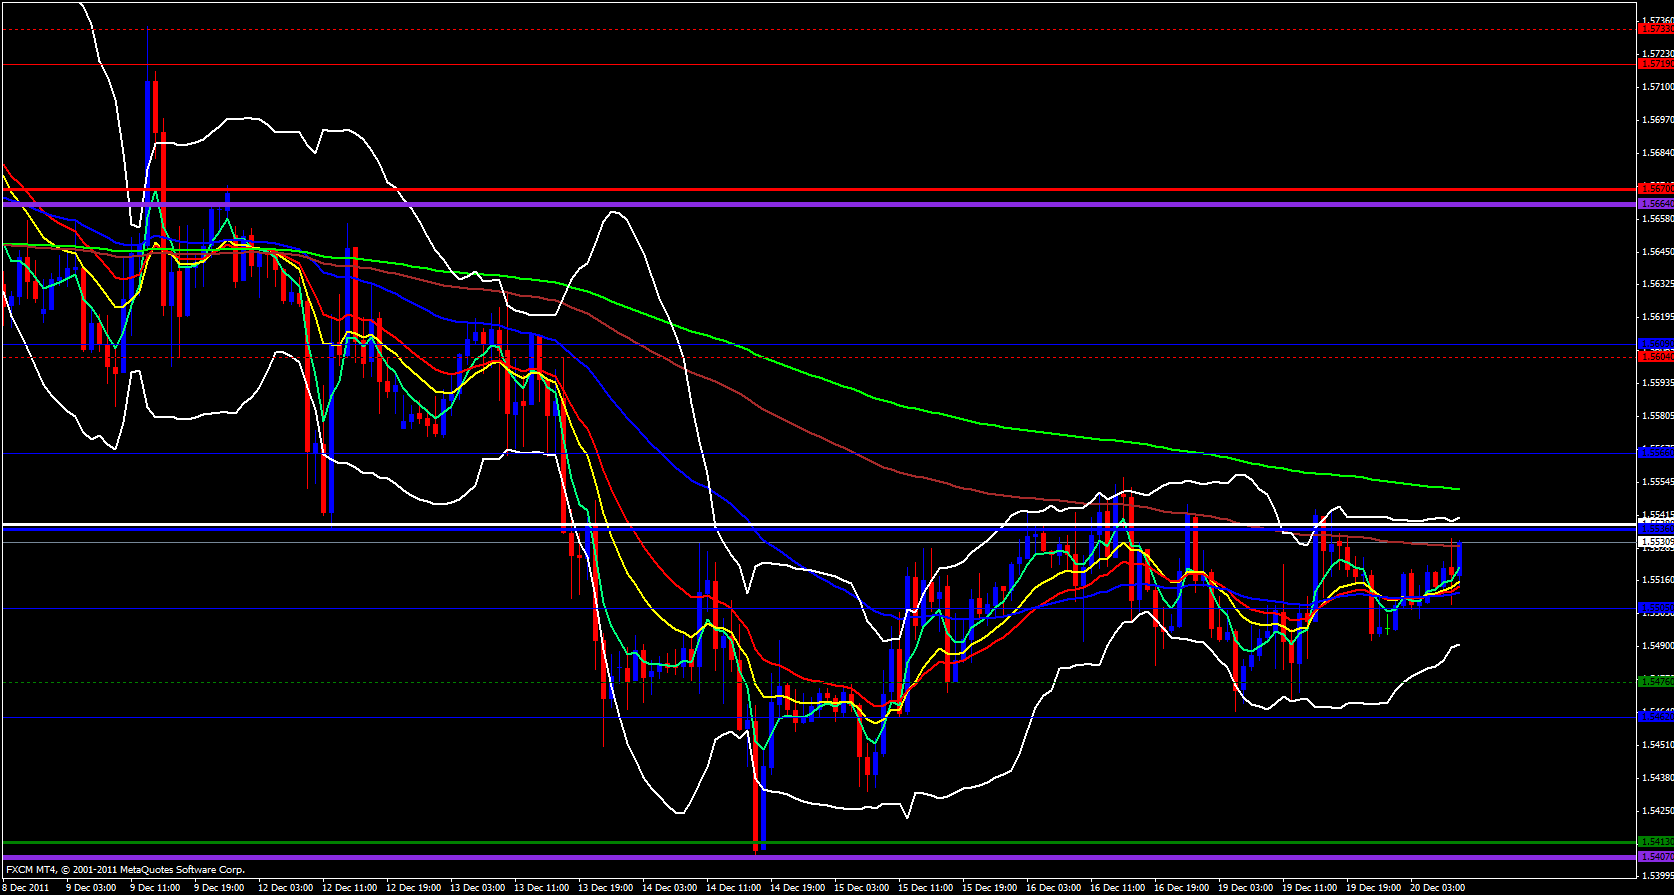
On the hourly time frame we are just below the 233 ema which is just above the weekly central pivot at 1.5538 As far as daily pivots price is approaching the daily M4 at around 1.5560 which is where I would expect price to begin falling so I would be watching for short positions at around 1.5560 and try to take it down to 1.5480 - 1.5465


