By: Doug Rosen
The GBP/USD begins its new week right on the 5 ema. The stochastics is pointing up and I don't believe this pair is done rising.
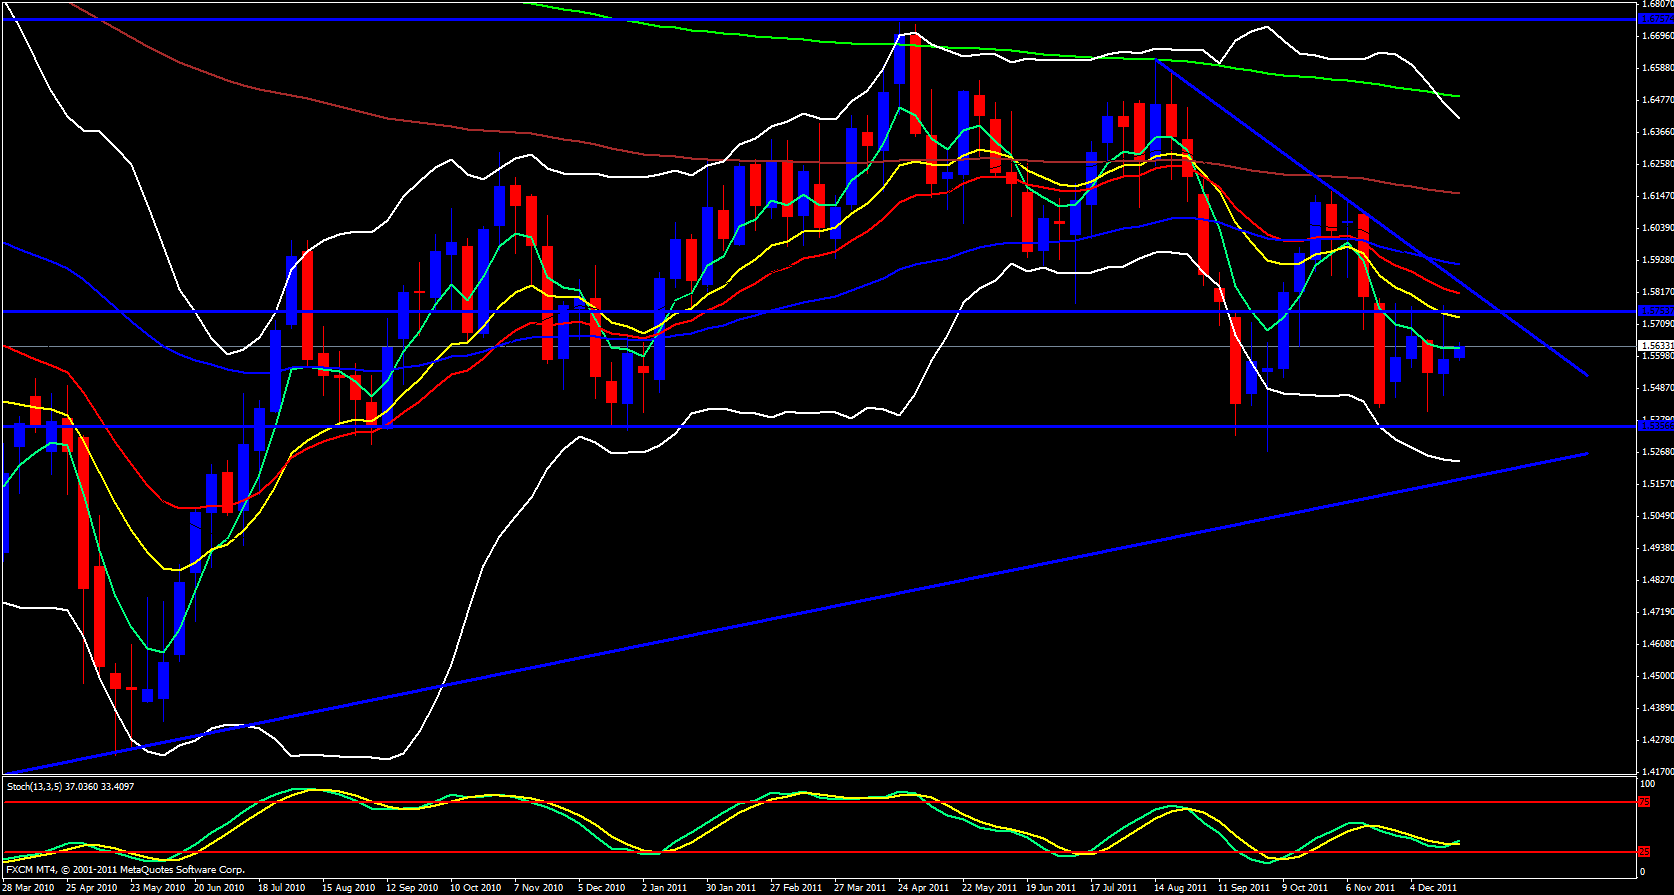
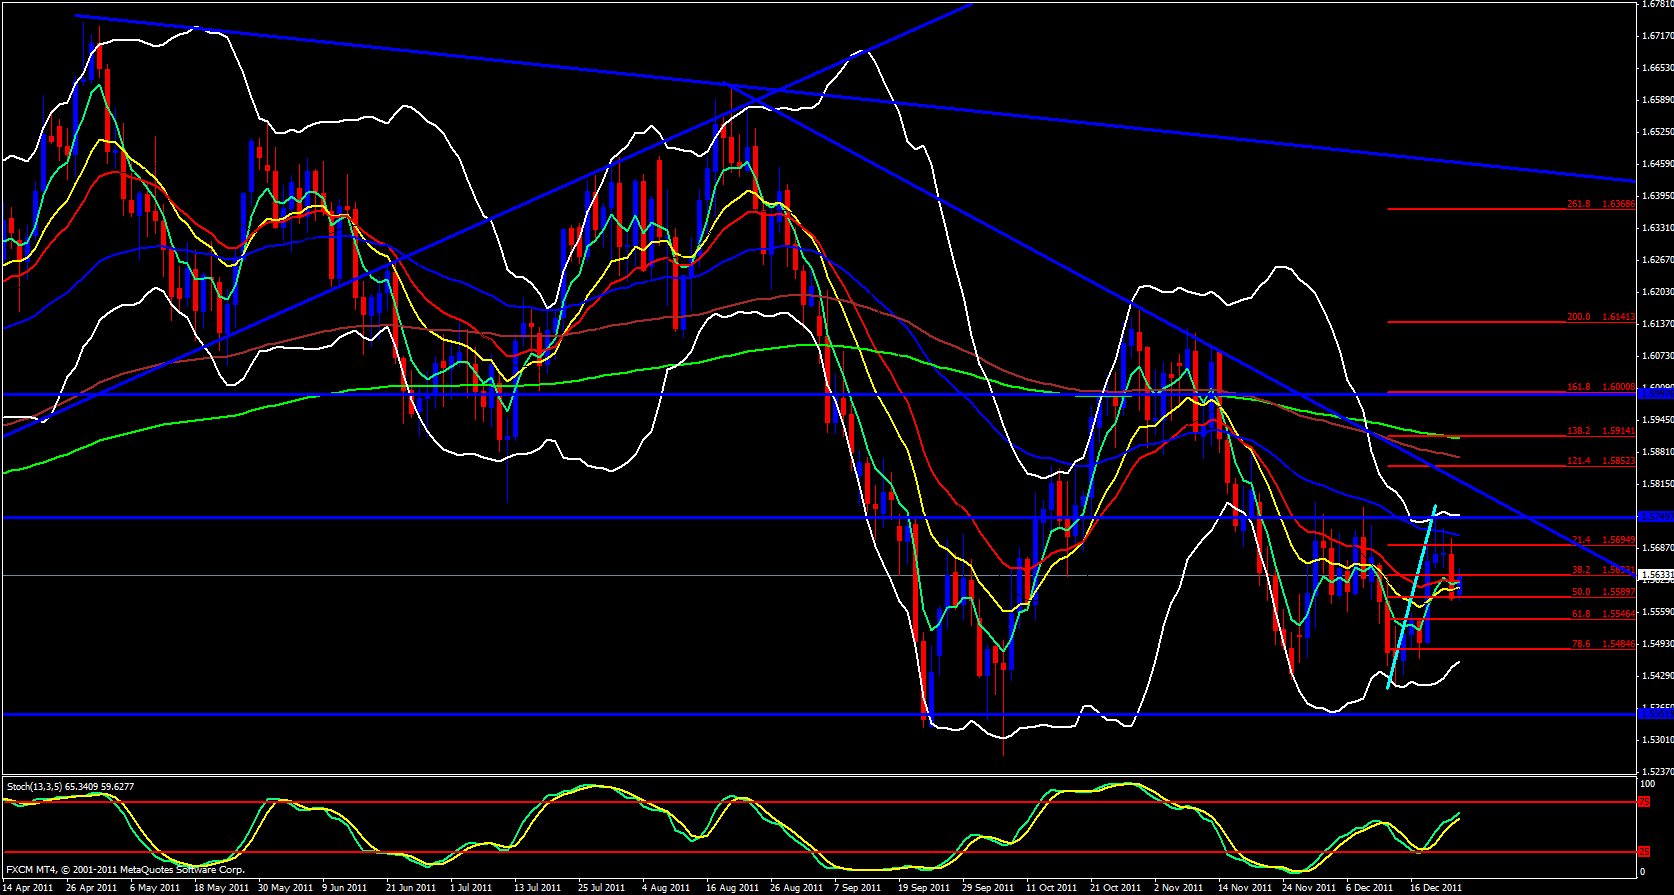
On the daily timeframe the stochastics is rising and pointing up and price is above the ema's. Price did make a 50.0 fib of the swing up at 1.5590 and appears to be heading up. The level at 1.5770 holds strong resistance so a break above that level could happen but it won't be so easy, after all, as it is it appears to be a triple top and a visit back up to that level should send price crashing down. I don't expect much movement today for this pair due to USA and UK Bank Holiday today and the previous 4 hour candle only moved 8 pips, the previous hourly candle picked up a bit and moved 22 pips.
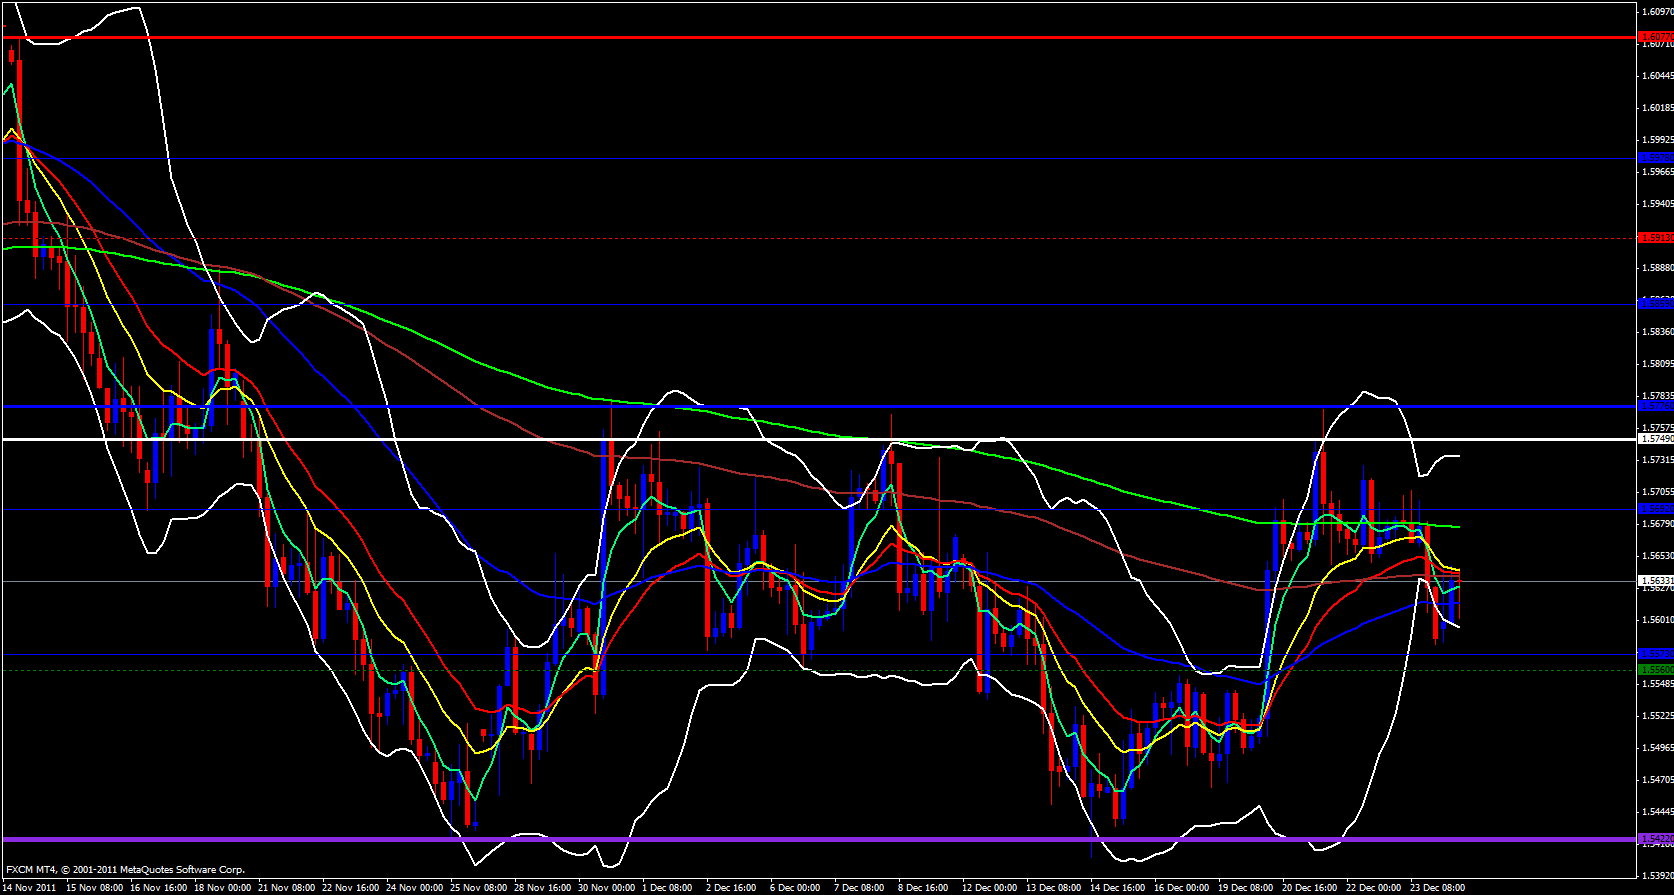
On the 4 hour timeframe price has bounced up a bit and is up against the 144, 21 and 13 ema's and price is at the 50.0 fib of the previous swing down so technically price has permission to fall.
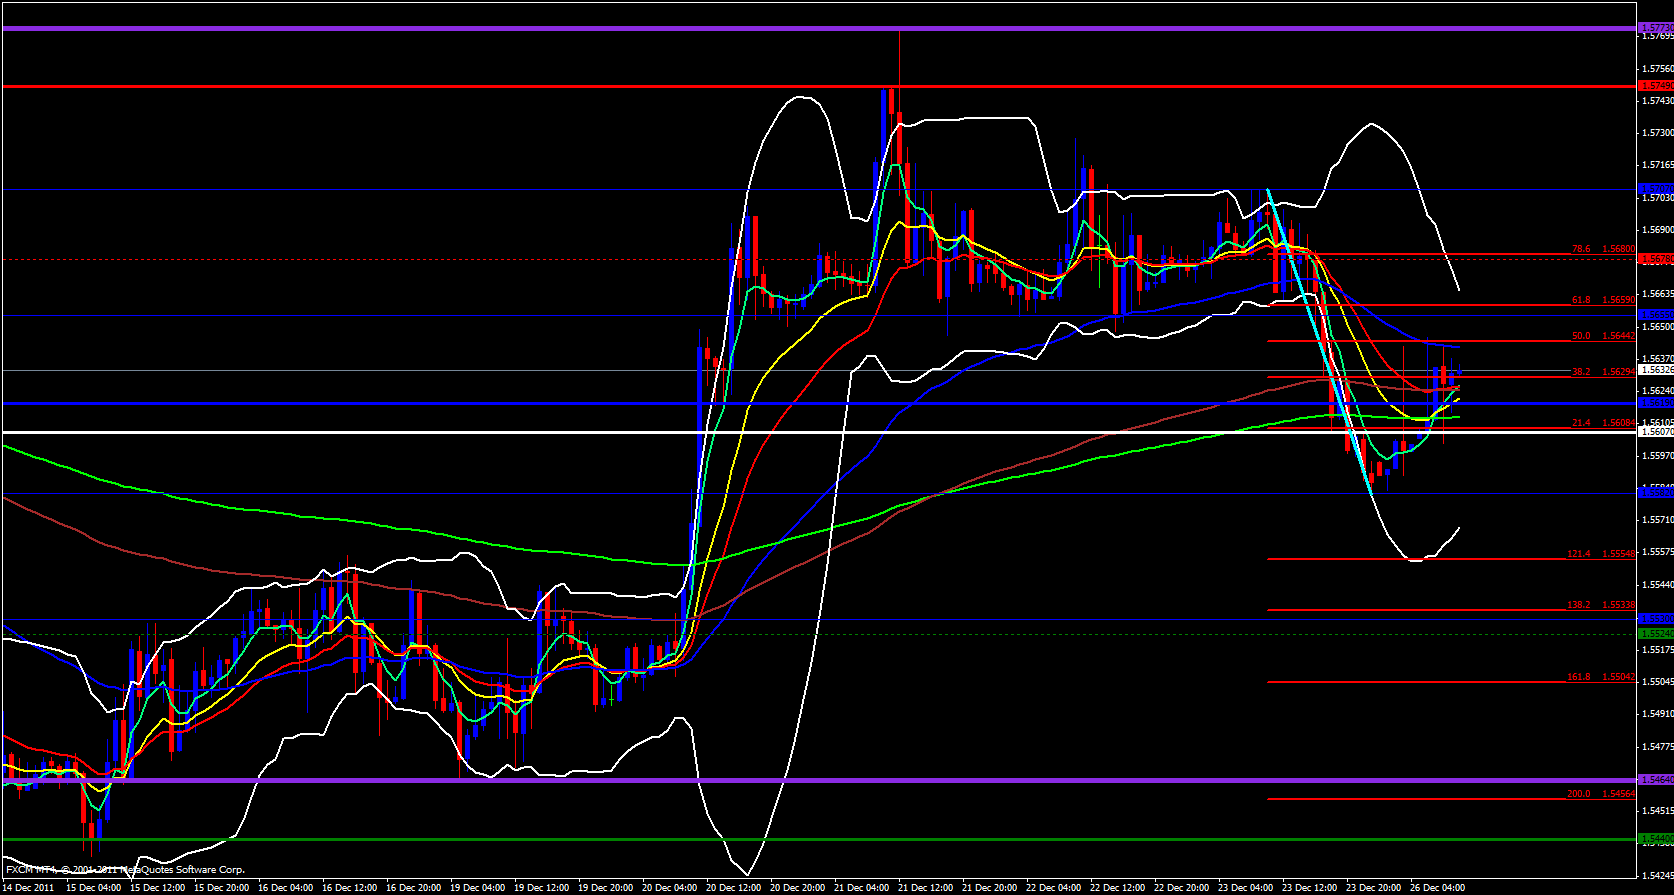
Moving on to the hourly timeframe the 55 ema overlaps with the 50.0 fib at 1.5644 and not too far above that at 1.5655 is previous support which had been broken and may now very well act as resistance.
On the 15 minute timeframe the 233 ema exists at 1.5645 which overlaps with the daily M3 so it would be safe to say that anywhere between 1.5645 and 1.5665 is resistance and this is the zone where I would expect to see price begin to fall and continue downward, however, I have said it several times today in my analysis to expect thinner than usual market conditions and not to expect much follow through on the moves since the market is short on traders today.
In an area where there could be thick resistance and you would expect the market to fall, there is a very good chance not much will happen so be careful if you trade this pair or any other pair for that matter.
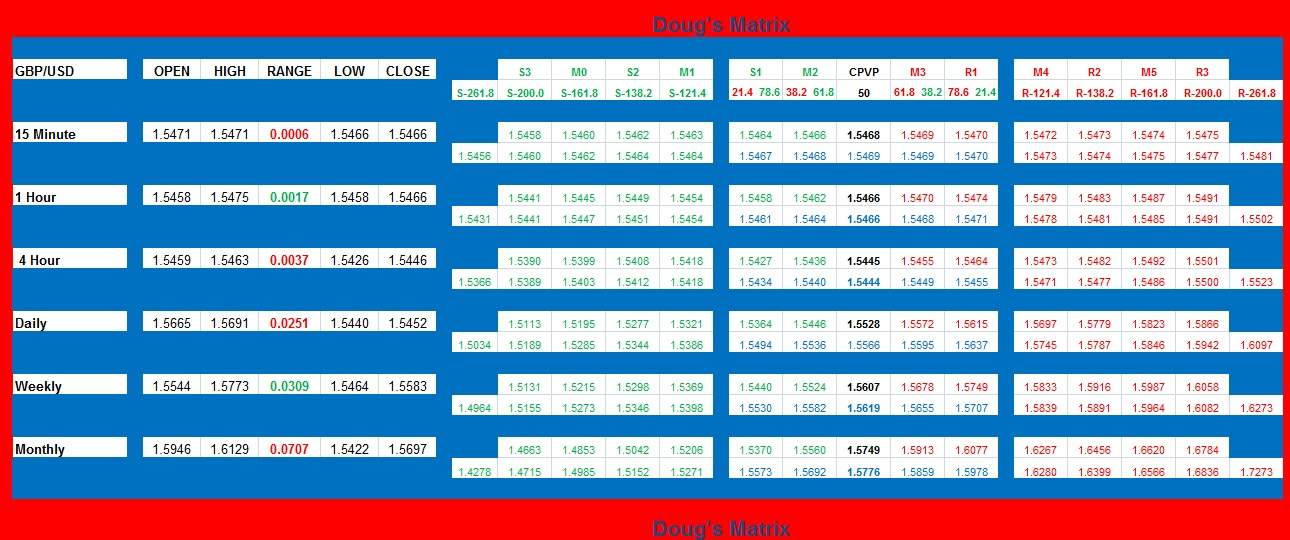
I will remind you all once again until you are all used to it that I have provided a table of levels for you to monitor. We will called it Doug's Matrix since it is of my own design and my name is Doug. It is simply a table that displays every pivot point from the monthly all the way down to the 15 minute, however, by the time you view it the 15 minute and hourly data will already be expired but I do recommend keeping an eye on all the other levels. In addition to the Pivot Point levels I have provided the Fib retracements and extensions of the previous candles also over the monthly to 15 minute timeframes but the same thing applies, pay attention mostly to the monthly to the 4 hour since the hourly and 15 minute will be expired. The 4 hour pivot and fib levels are good until 10:00 AM GMT. The levels indicated in Doug's Matrix will keep you out of danger and put you into profitable opportunities.


