By: Doug Rosen
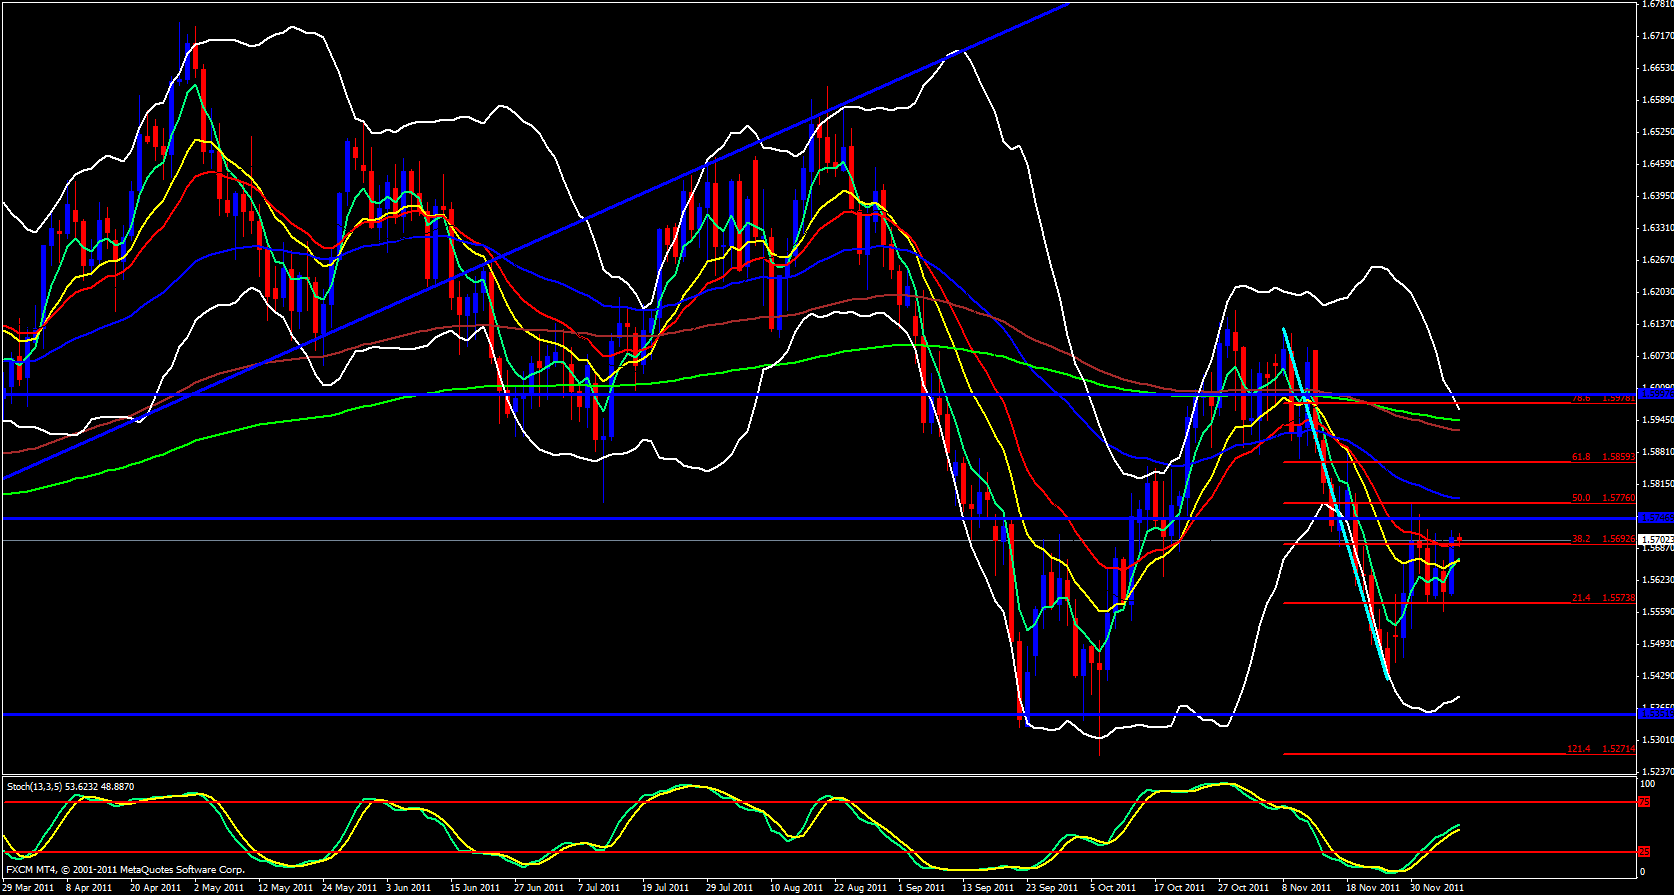
The GBP/USD kicks off the new trading day just above the daily 21 ema with a 5 ema trying to cross above the 13 ema and a daily stochastic pointing up, however, price is also caught in a fib zone to the downside and price is right in the 38.2 fib level of the last move down.
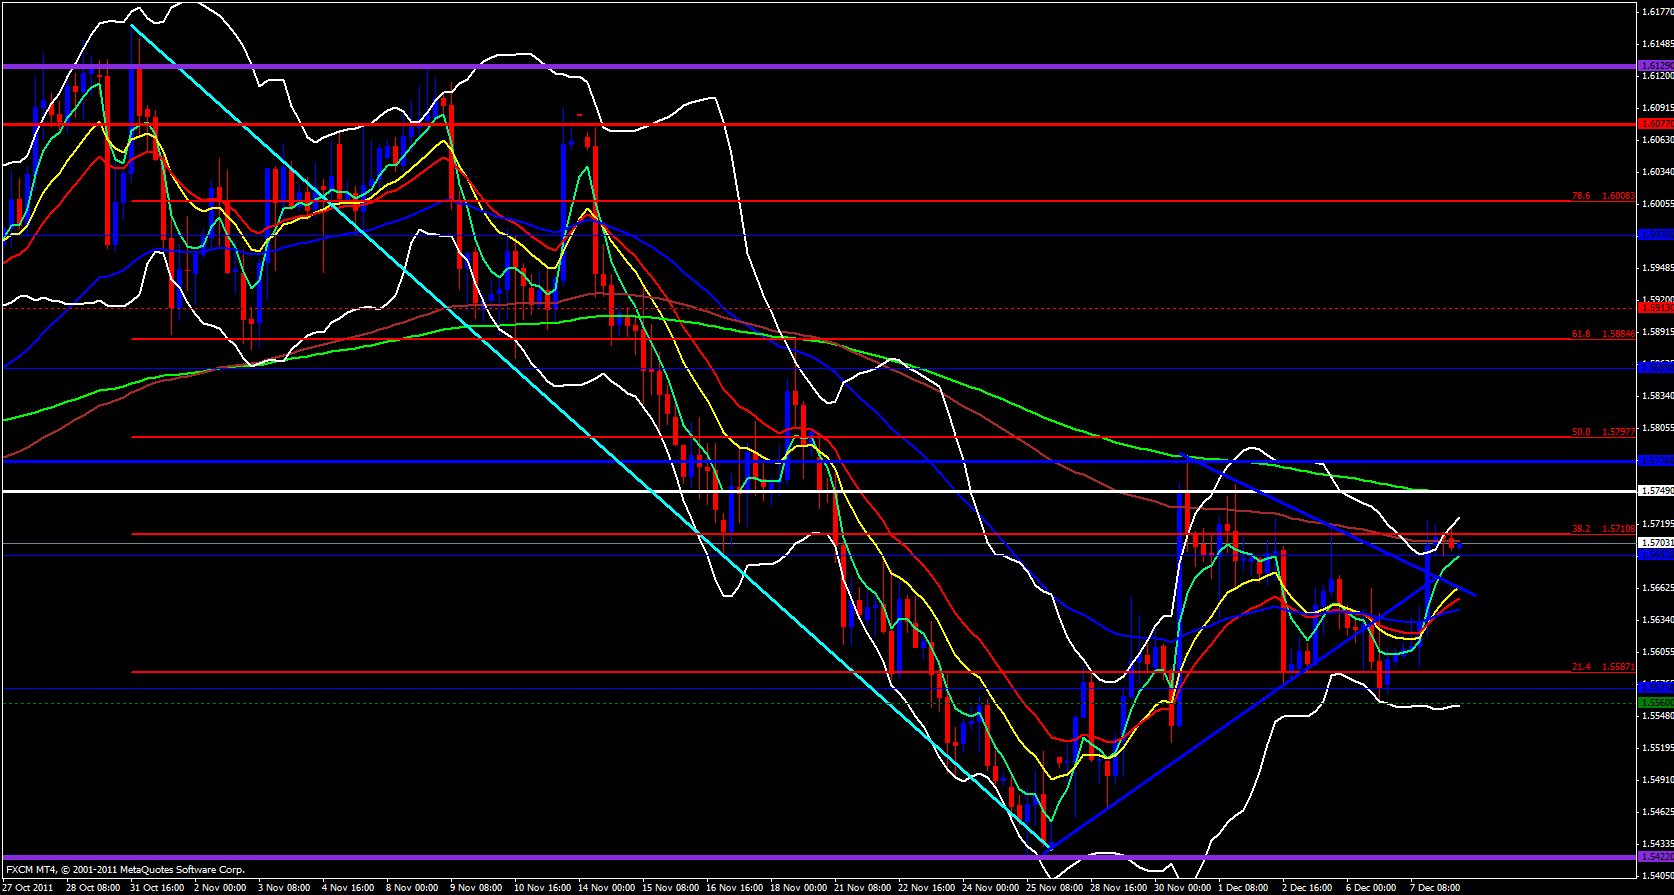
On the 4 hour time frame the upper Bollinger band is open and pointing up and price is riding just above the 5 ema but up against the 144 ema as well as the 38.2 fib of the last major move down. It is very obvious while looking at the 4 hour price action that price has been in a range since yesterday.
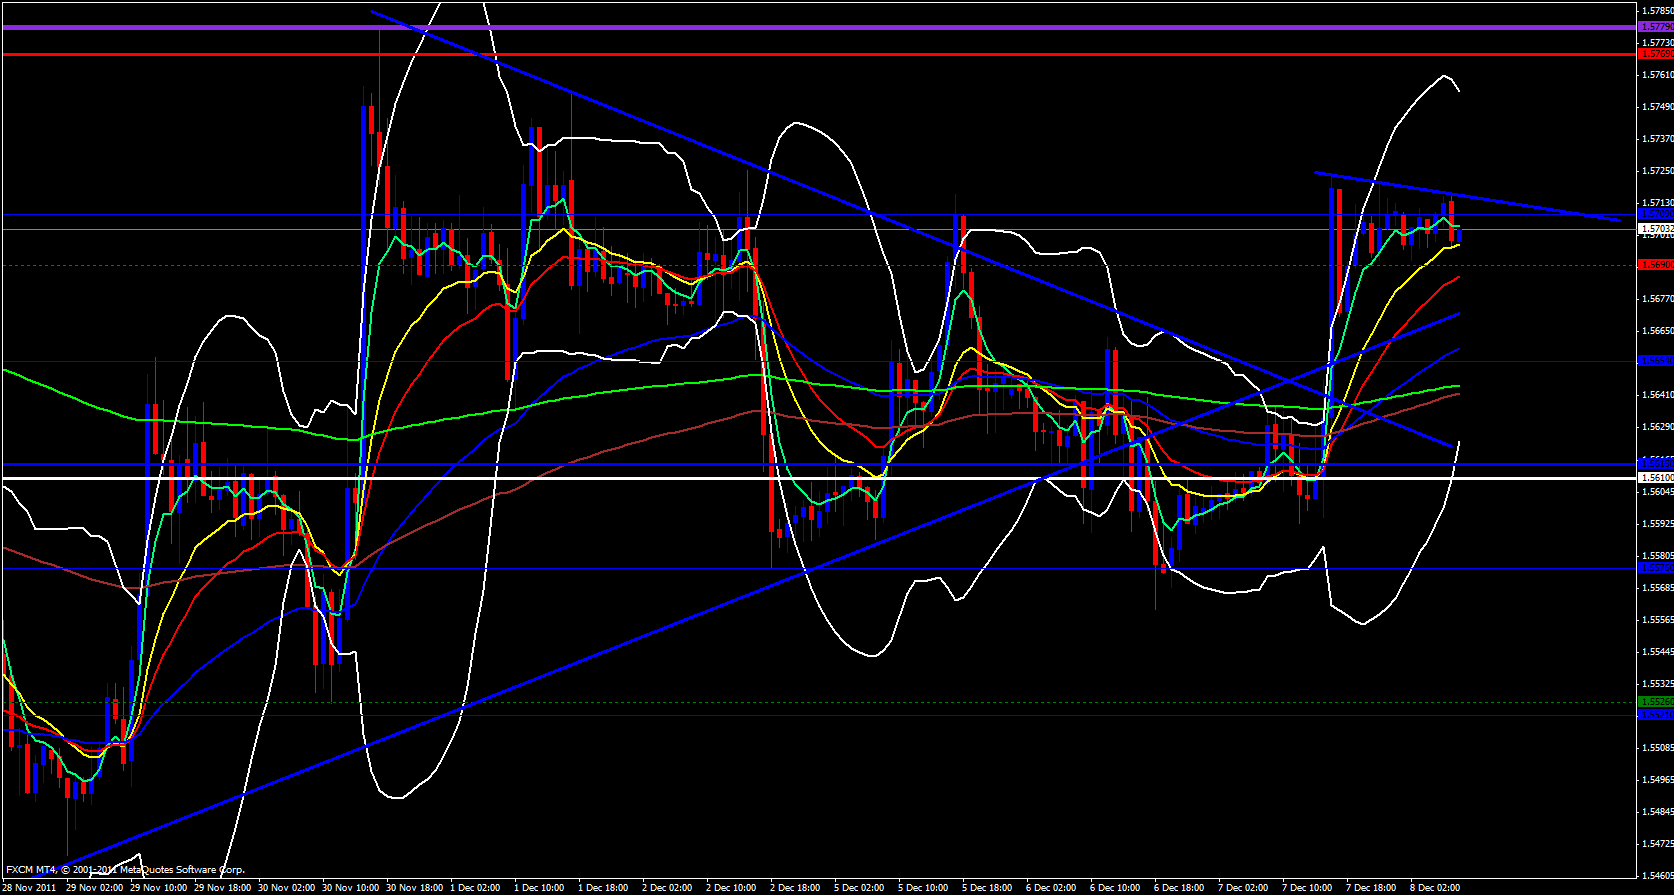
On the hourly time frame price has been in a bit of a tight range and the 5 ema and the 13 ema are getting very close to each other indicating minimal volatility and momentum.
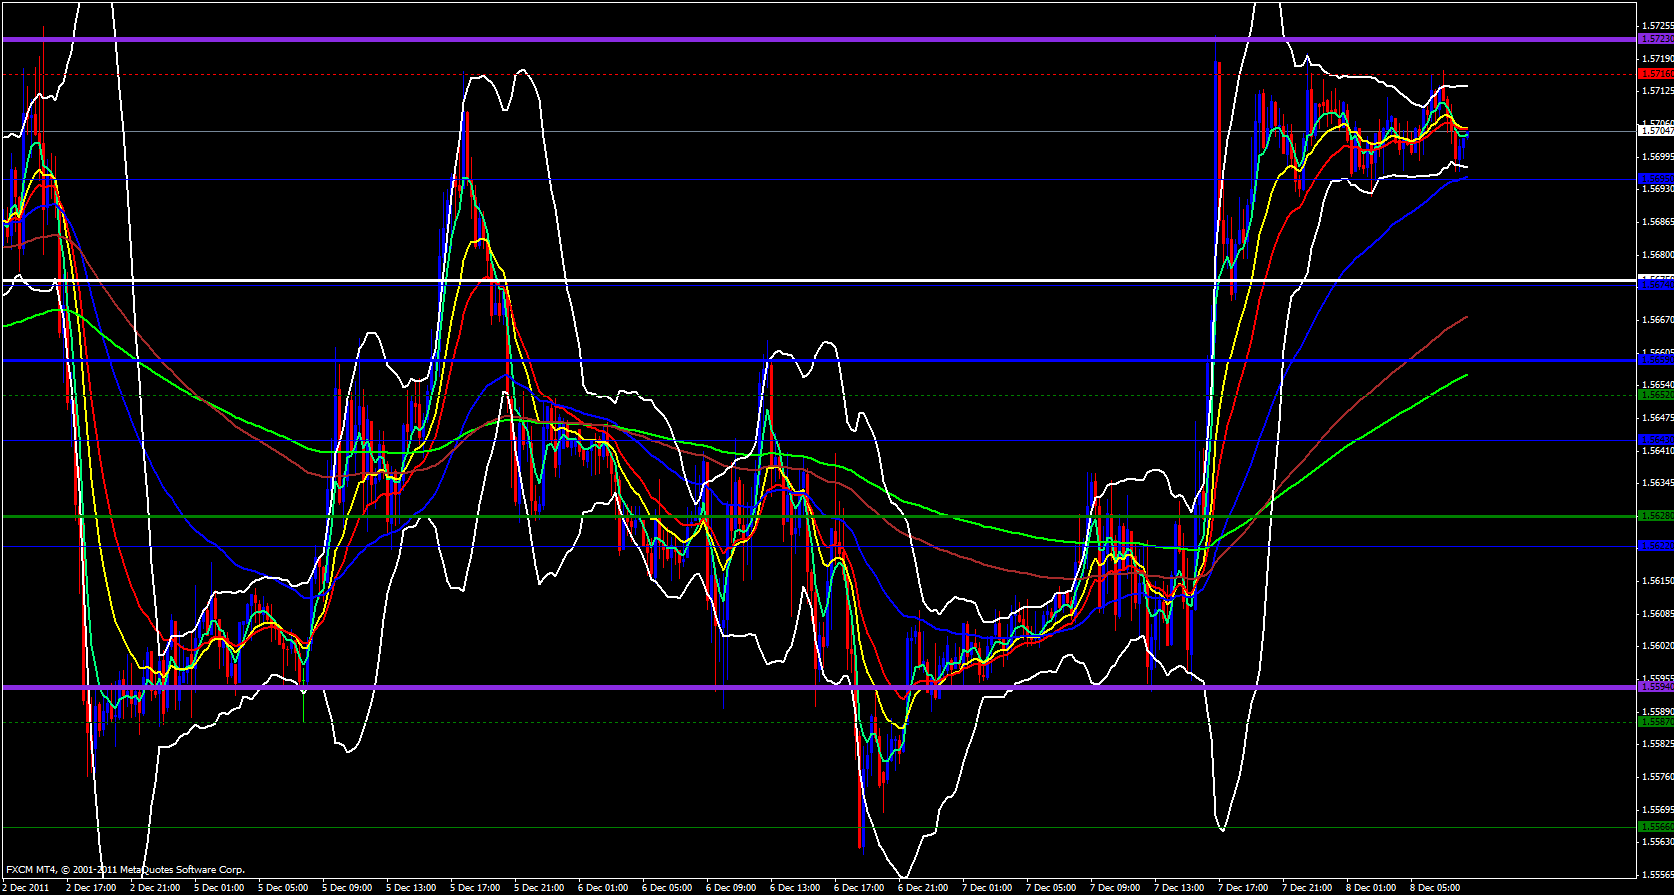
Finally, on the 15 minute ema's are all bunched up together and the Bollinger bands are narrow indicating low volatility. Price is in a tight range on the 15 minute time frame and we will have to wait for price to break the range in either direction before taking on any positions.


