By: Colin Jessup
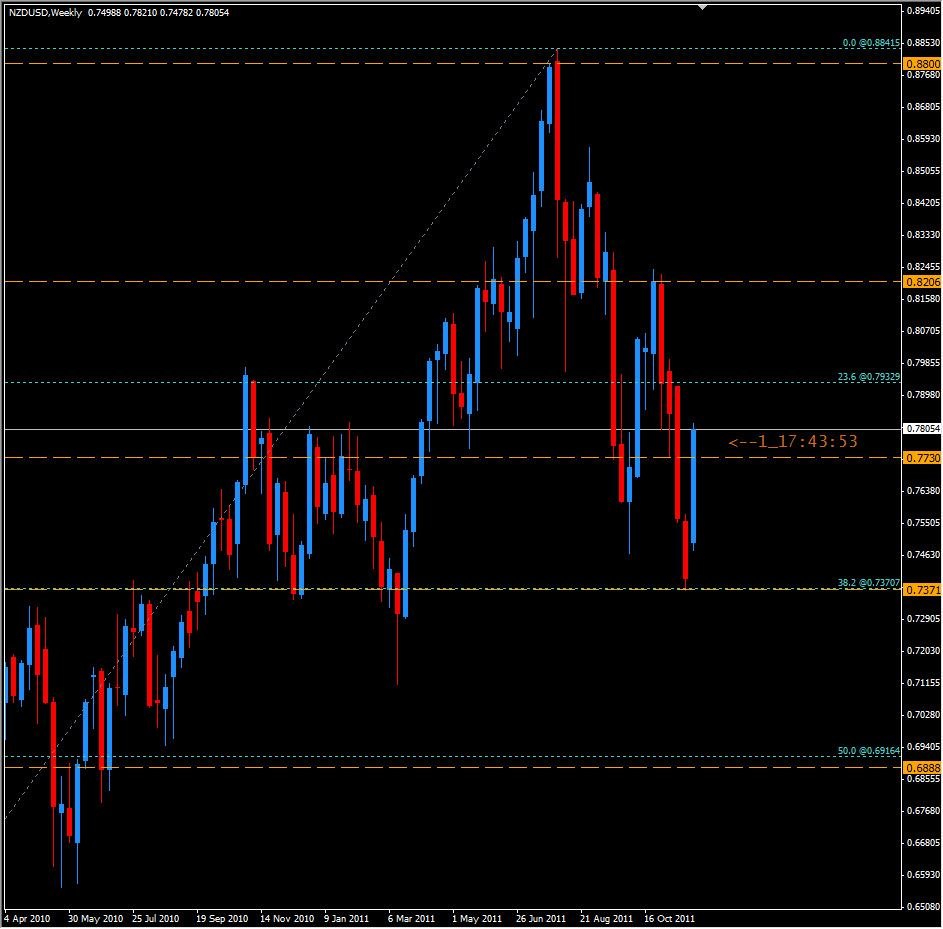
The Kiwi, or NZD/USD has been basically Bullish since March 2009 when it hit a low of 0.48939. It reached what appeared to be the end of its bullish run in July of this year, cresting at 0.88415 and falling immediately after. Last week it stopped its bearish free fall at the 0.7370 +/- area which just happens to be a well established support/resistance zone...and the 38.2% retracement level of the bullish run that started in March of 2009. This week, thanks in no small part to the big 6 banks intervention, it has so far moved about 400 pips with the bulls pushing at its tail from below. Does this imply that we could be seeing a more bullish Kiwi going forward? Maybe, but markets do not rise or fall in straight lines, so this could also just be a retracement before the bears pull it further down. Long term, if this weekly candle closes above 0.7730, I might bet on the bulls and try to ride it higher to 0.8056 or even 0.8200...but if price drops, and we see a weekly close below 0.7730, I'd put some money on the bears to pull it down at least to the support zone of 0.7730.
Happy Trading!

