By: Doug Rosen
As with all the pairs I have analyzed there was very little price action and for a pair that averages 100 - 120 pips a day and even more at times this pair only did 29 pips but that's not so much due to lack of volatility as it was a Bank Holiday pretty much throughout most of the world and any price movement we experienced in the last 24 hours was mostly incidental of currency being exchanged between international borders. So, as I had spotted yesterday, the new weekly candle is below the weekly 5 ema and as I always preach needs to make its way back up to the 5 ema in order for it to continue its path to the downside. That is about all there is to say about this pair at the weekly level, it needs to kiss the weekly 5 ema and that is it. If it does not make it to the 5 ema just yet, then I know that sooner or later it will and it will be hard to look at shorts for this pair knowing that sooner or later it will need to head back up.

The weekly 5 ema coincides with the daily 21 ema at 102.58, however, I would really like to see price wick the daily 21 ema and touch the 102.82 level since that is the 38.2 fib of the previous swing to the downside.

On the 4 hour timeframe I have this pair in a triangle price trap. At this moment price is sitting on the monthly S1 pivot and this level seems to be acting as strong support.

I expect this pair to head up just a bit to it can head down and the 55 ema is around 102.00 which will cause a bit of contention but may offer a pullback opportunity to catch a long to around 102.50 which was last month's low as well as an area of previously respected resistance which was also support not too long ago and areas that were previously support that was broken that became resistance tends to be highly respected. In the trading world we traders love levels that have experienced role reversal.

Finally, on the hourly timeframe I see that price is hanging out just below the weekly central pivot around 101.86 and seems to be in a tight range between 101.74 - 101.91 so a break above 101.91 then a retest will confirm we are heading up to at least 102.05 which is where the hourly 233 ema which could be what sends price down but I would really like to see it break that level and head up to 102.46 which overlaps with the weekly R1 pivot then to see price fall but keep in mind to get to that level we need to get past 102.16 which happens to be the weekly M3 pivot.

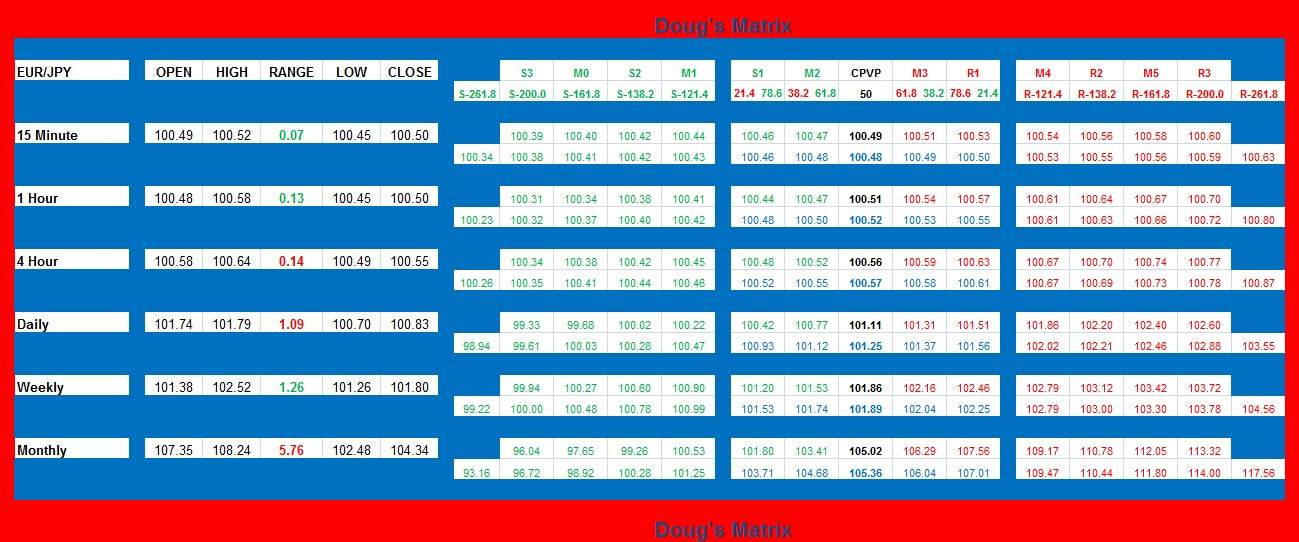
I am reminding you all once again until you are all used to it that I have provided a table of levels for you all to monitor, which I’ve dubbed as Doug's Matrix. Even if some of the levels are expired by the time you read this, I strongly recommend keeping an eye on all the other levels. In addition to the Pivot Point levels I have provided the Fib retracements and extensions of the previous candles also over the monthly to 15 minute timeframes but the same thing applies, pay attention mostly to the monthly to the 4 hour since the hourly and 15 minute will be expired. The 4 hour pivot and fib levels are valid until 10:00 AM GMT.
