By: Doug Rosen
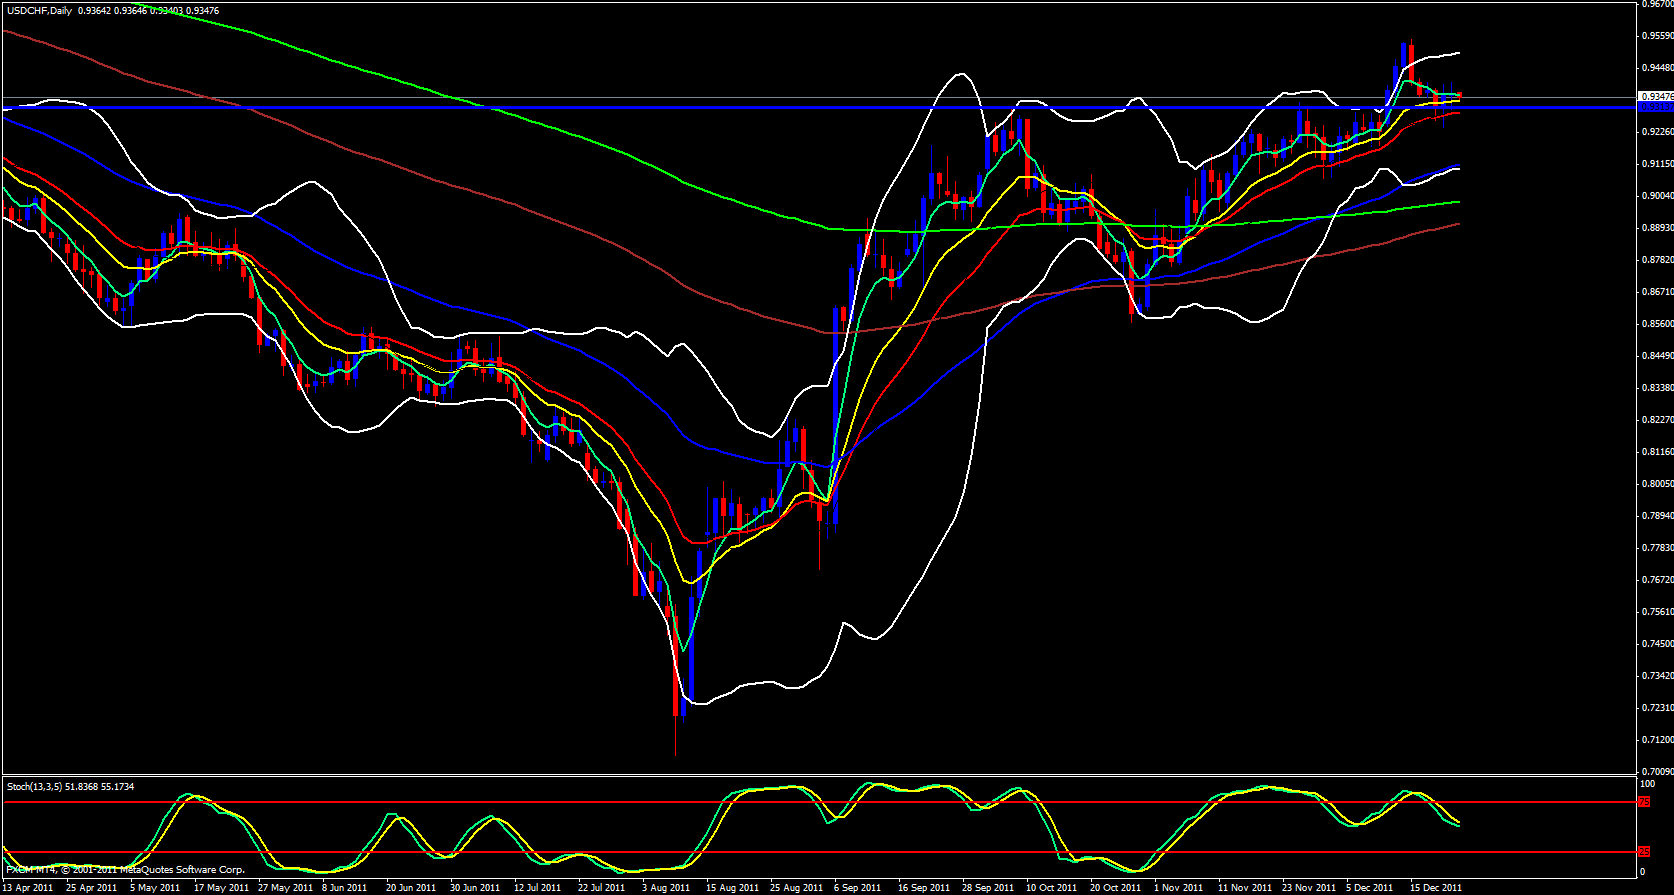
The Swissy yesterday, just like the EUR/GBP made a Doji. The only difference is that the EUR/GBP made its Doji at support and the USDCHF made its Doji at resistance. Interesting enough the difference between the open and close for the Swissy was just 5 pips and the EUR/GBP was 4 pips.
In the case of the Swissy the resistance level was not an ema as was the case with the EUR/GBP but it was the 50.0 fib level of the last major move down this pair made awhile ago. Keep in mind we are talking about a weekly time frame. The .9400 level is proving to be a very important level since price seems to want to remain in that area but cannot seem to close above it and this has been going on for a few months now. Usually when price seems to stay at an area of resistance for so long and conversely support usually at some point it will break through as opposed to reversing. It means there is much conviction in the market that such an area will be broken.
On the daily time frame price remains above the 21 ema and has managed to stay above the 21 ema since November.
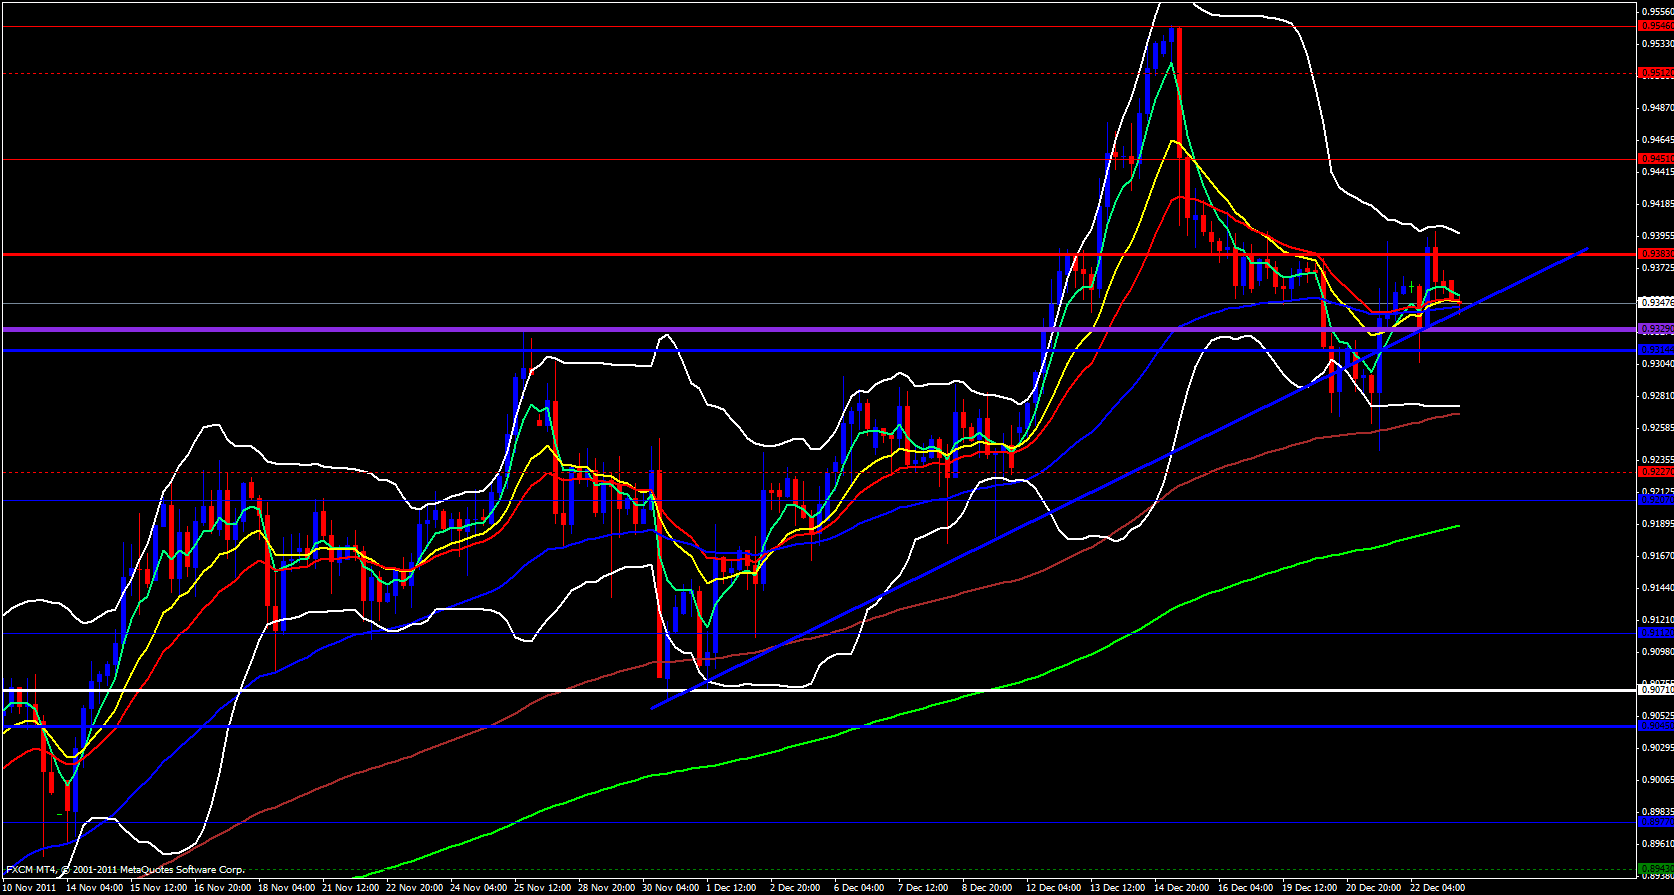
On the 4 hour time frame price is obviously very calm. Ema's are bunched together and the Bollinger bands are closed. I explained in my analysis for the EUR/GBP that most of the major market movers are already on their Christmas vacations sucking down cocktails so I don't expect any major market movement today.
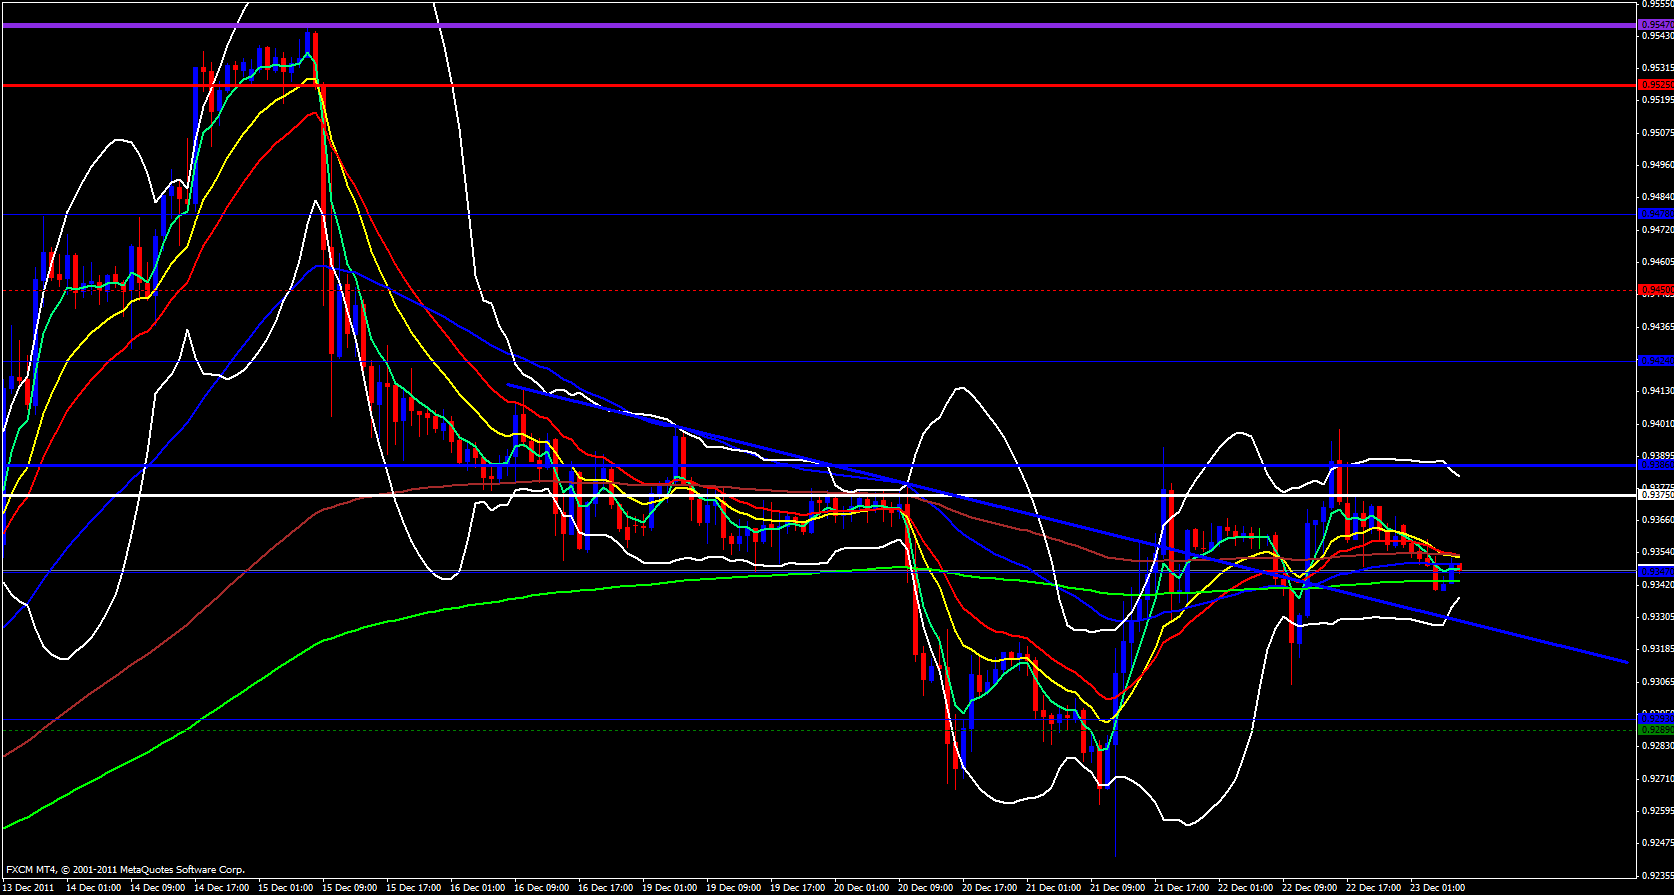
Price is however above the 233 ema on the hourly time frame but the 233 ema is very flat which means no trend at the moment.
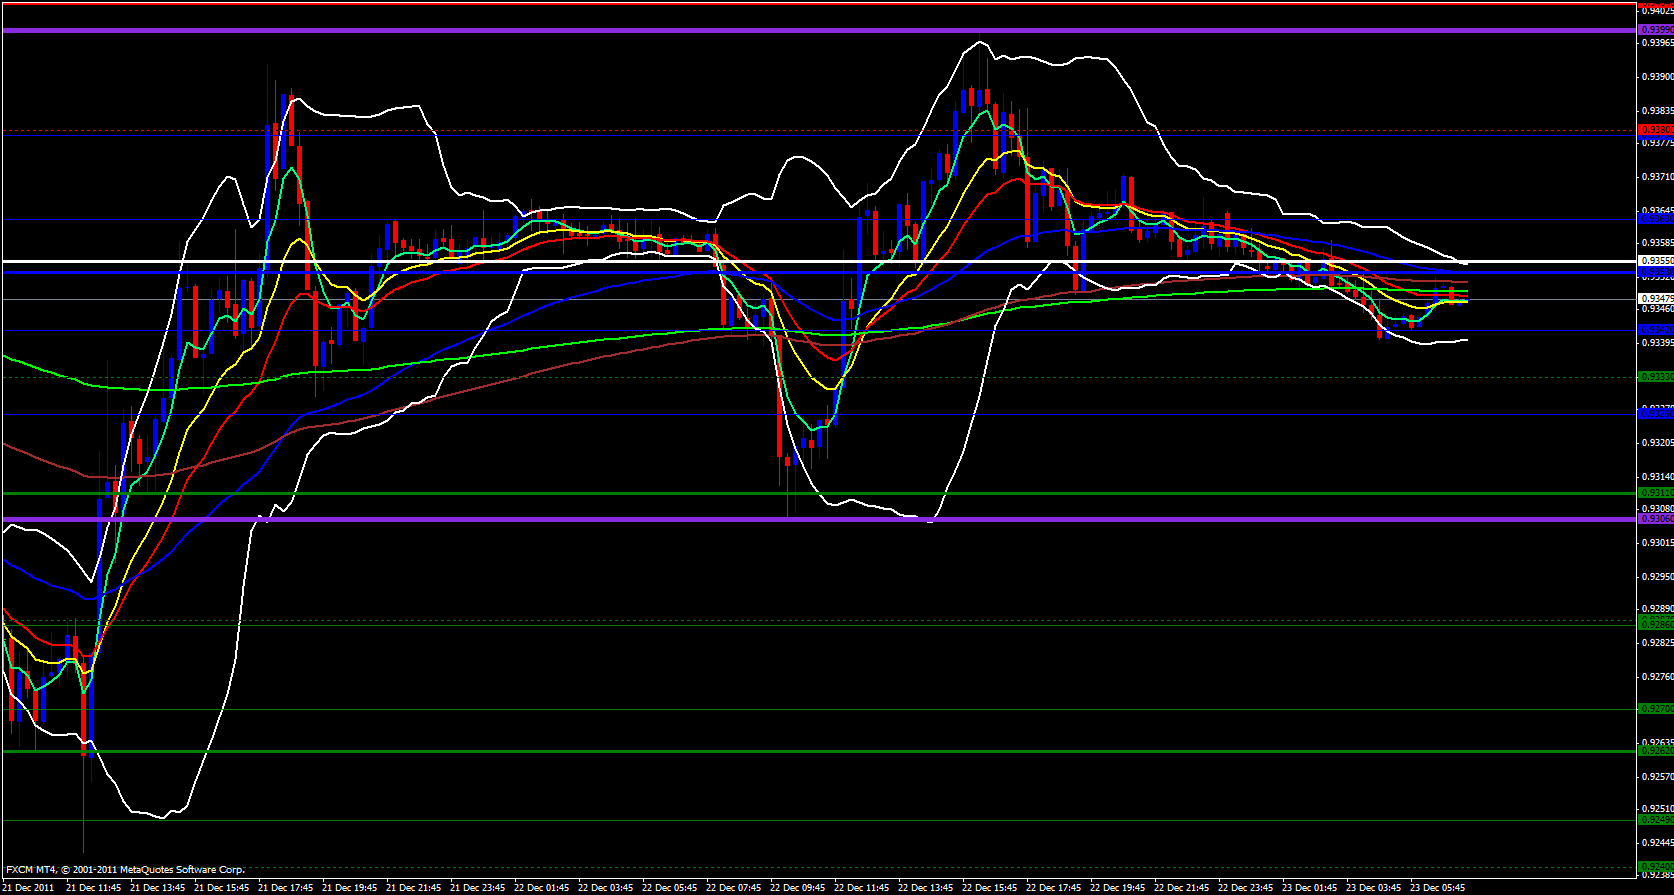
On the 15 minute time frame price is range bound, however, below the 233, 144 and 55 ema's as well as the daily central pivot so if the market moves tonight my guess would be to the downside. A break and retest above the central pivot at .9355 will indicate a move to the upside otherwise this pair will either maintain range bound action or should drop a bit more before heading back up.
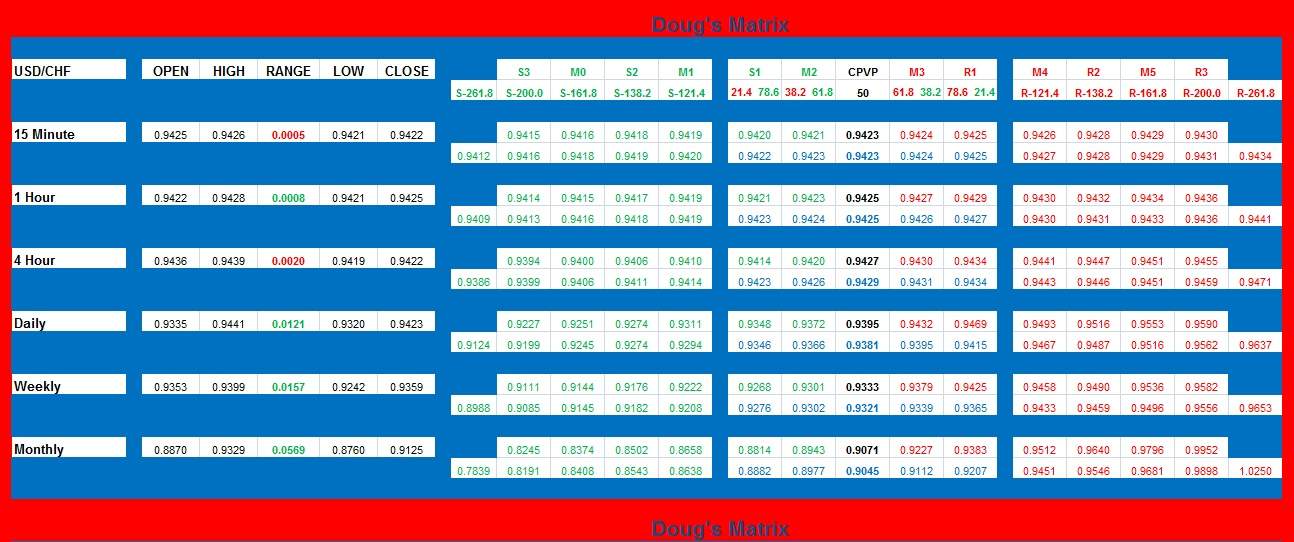
Included in my analysis is my custom made Support & Resistance Matrix which points out the various levels of support and resistance over multiple timeframes mathematically based on Pivot Point and Fibonacci theory so keep an eye on those price levels prior to entering any positions. It may save you from entering longs at resistance or entering shorts at support.

