By: Doug Rosen
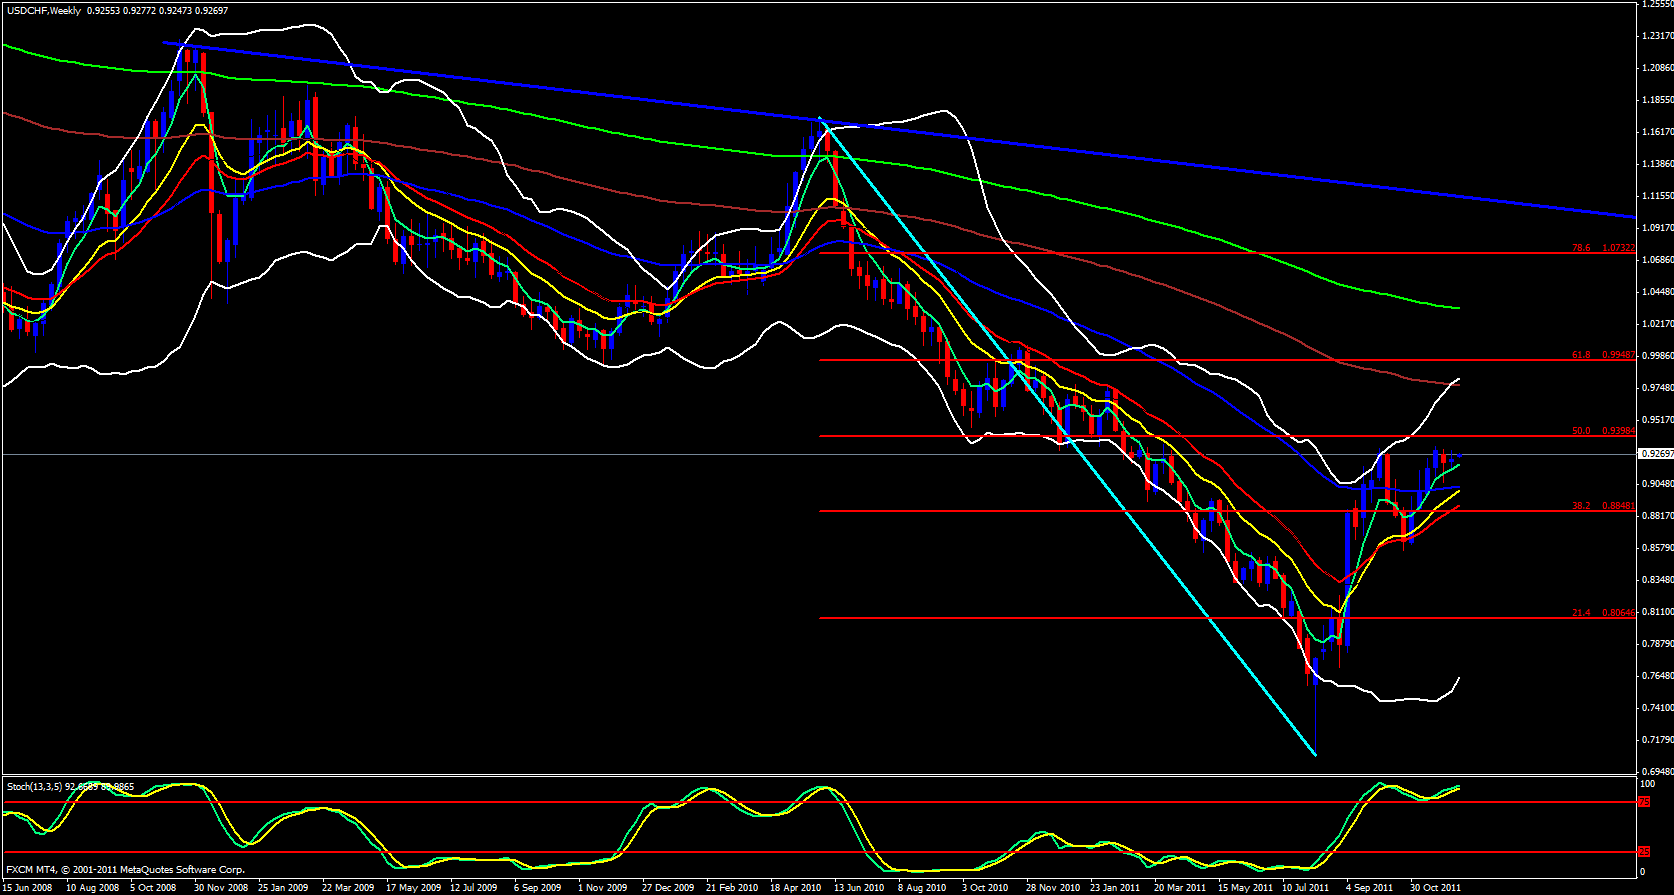
The Swissy weekly candle opens up just on and above the 5 ema and is nearing that 50.0 fib zone of the last major move down at around .9400 so it will be very interesting what happens around that level. The weekly 144 ema is just below the 61.8 fib level around .9770 so if price broke .9400 that is where I would expect it to go to based on a weekly perspective.
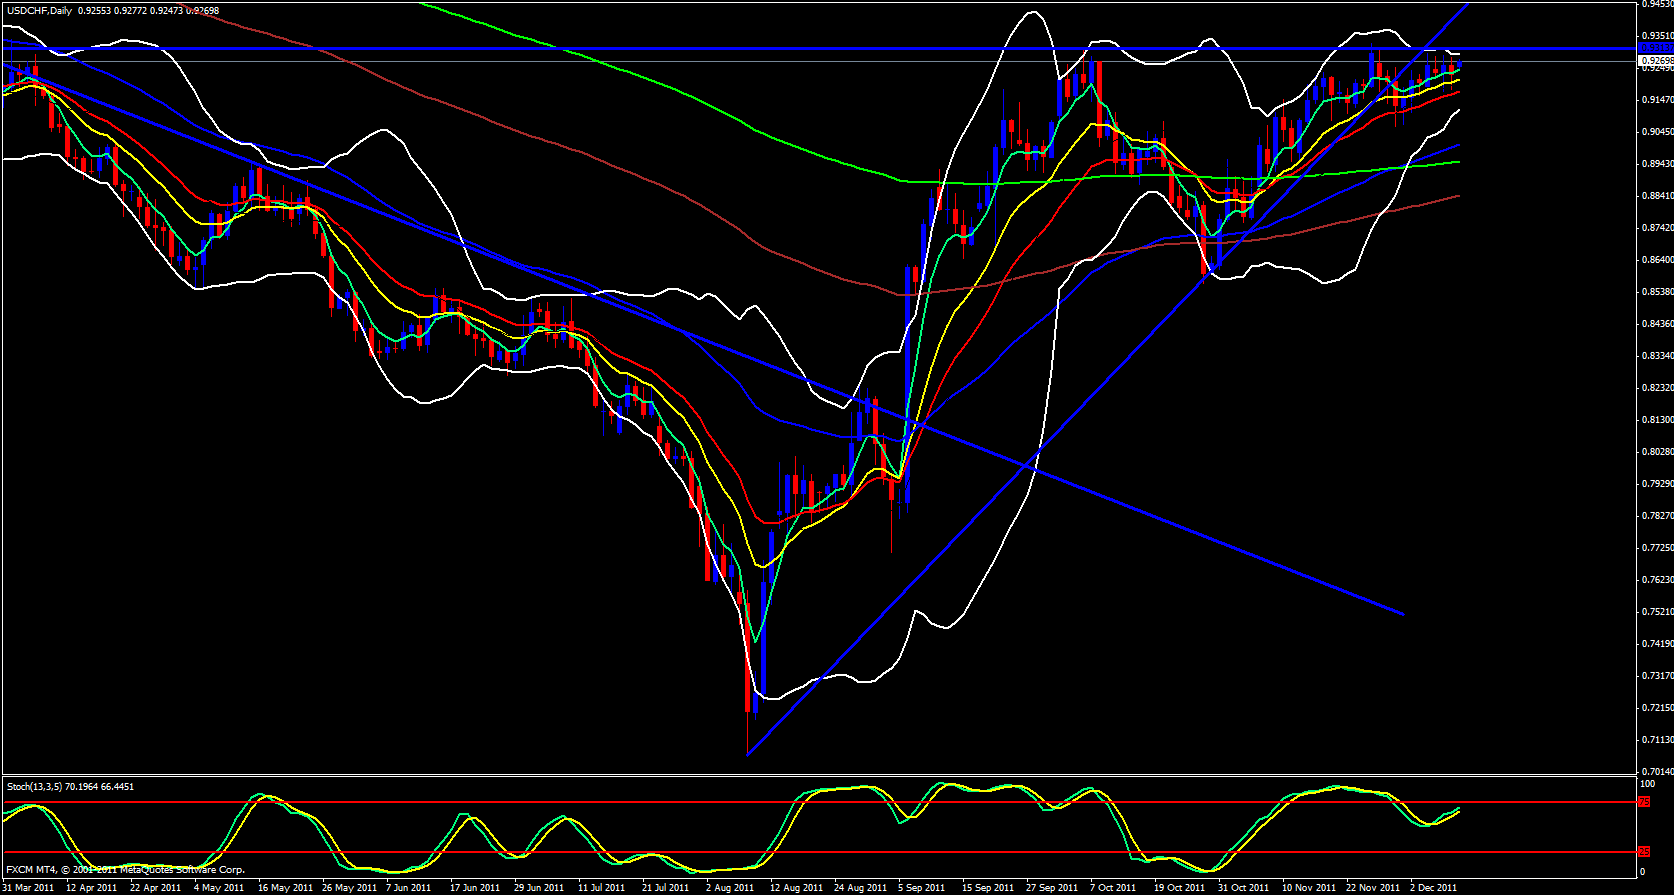
On the daily time frame price is nearing the .9315 which has help up as resistance several times in the past and was brief support shortly before being reached. Technically speaking this is the area where price could tank. Or will it break out above .9315?
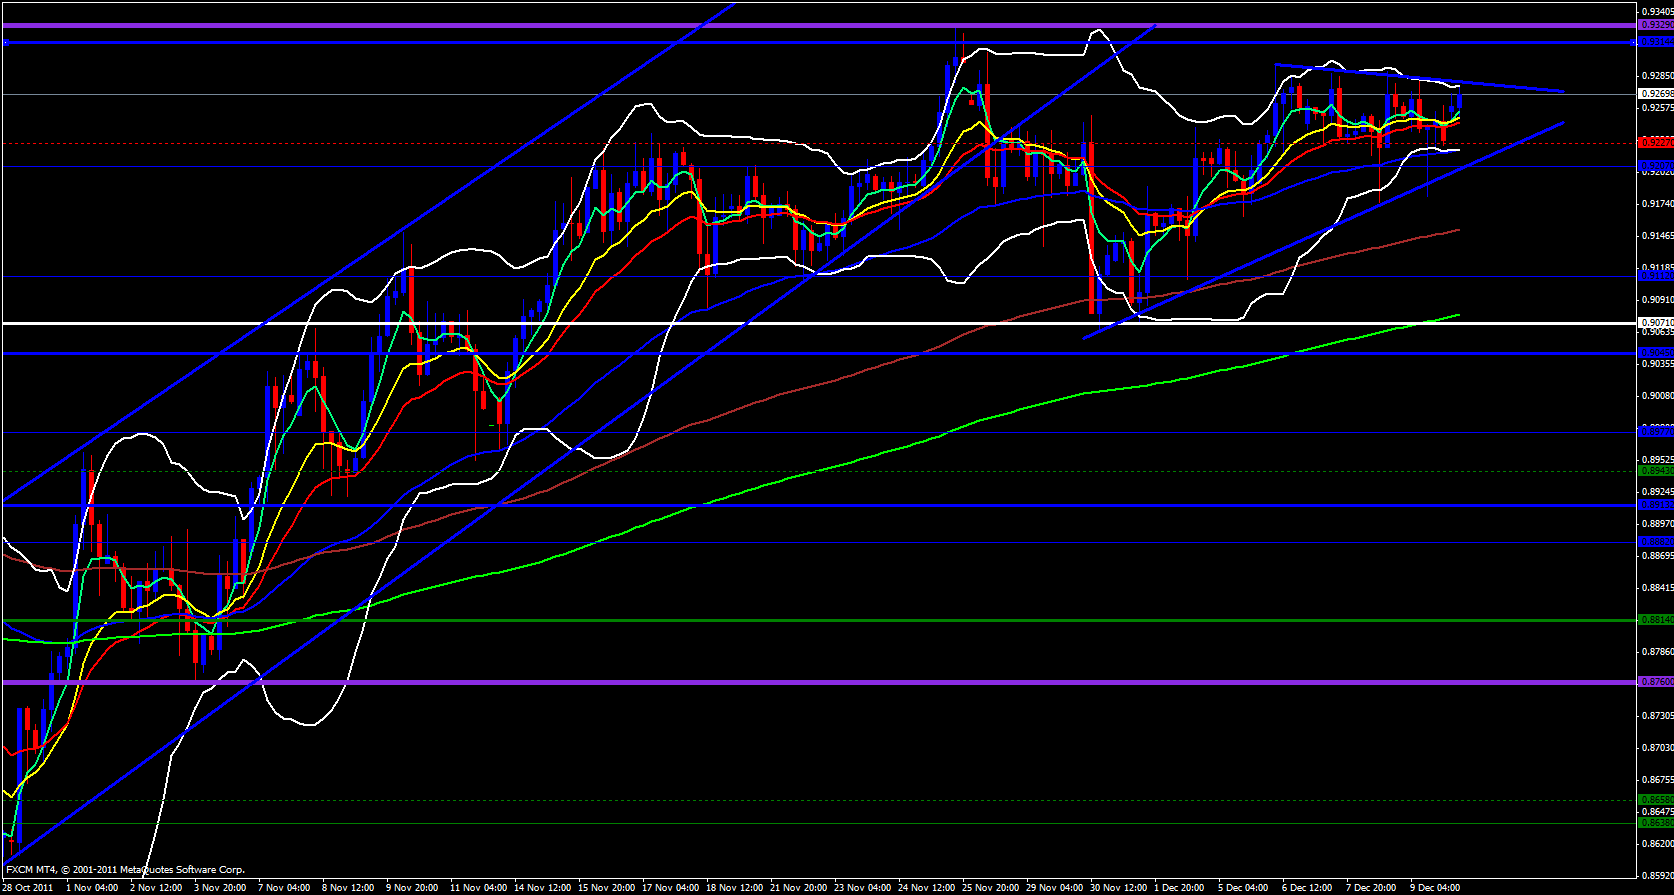
On the 4 hour time frame price is within a triangle price trap pattern and price is up against the top of the nose area which has been tapped around 5 times previously and rejected each time there is no reason to think it won't be rejected again and a breakout isn't a breakout until it already happens then price its right at an area where it can just tank from. Or it can break out to the upside.
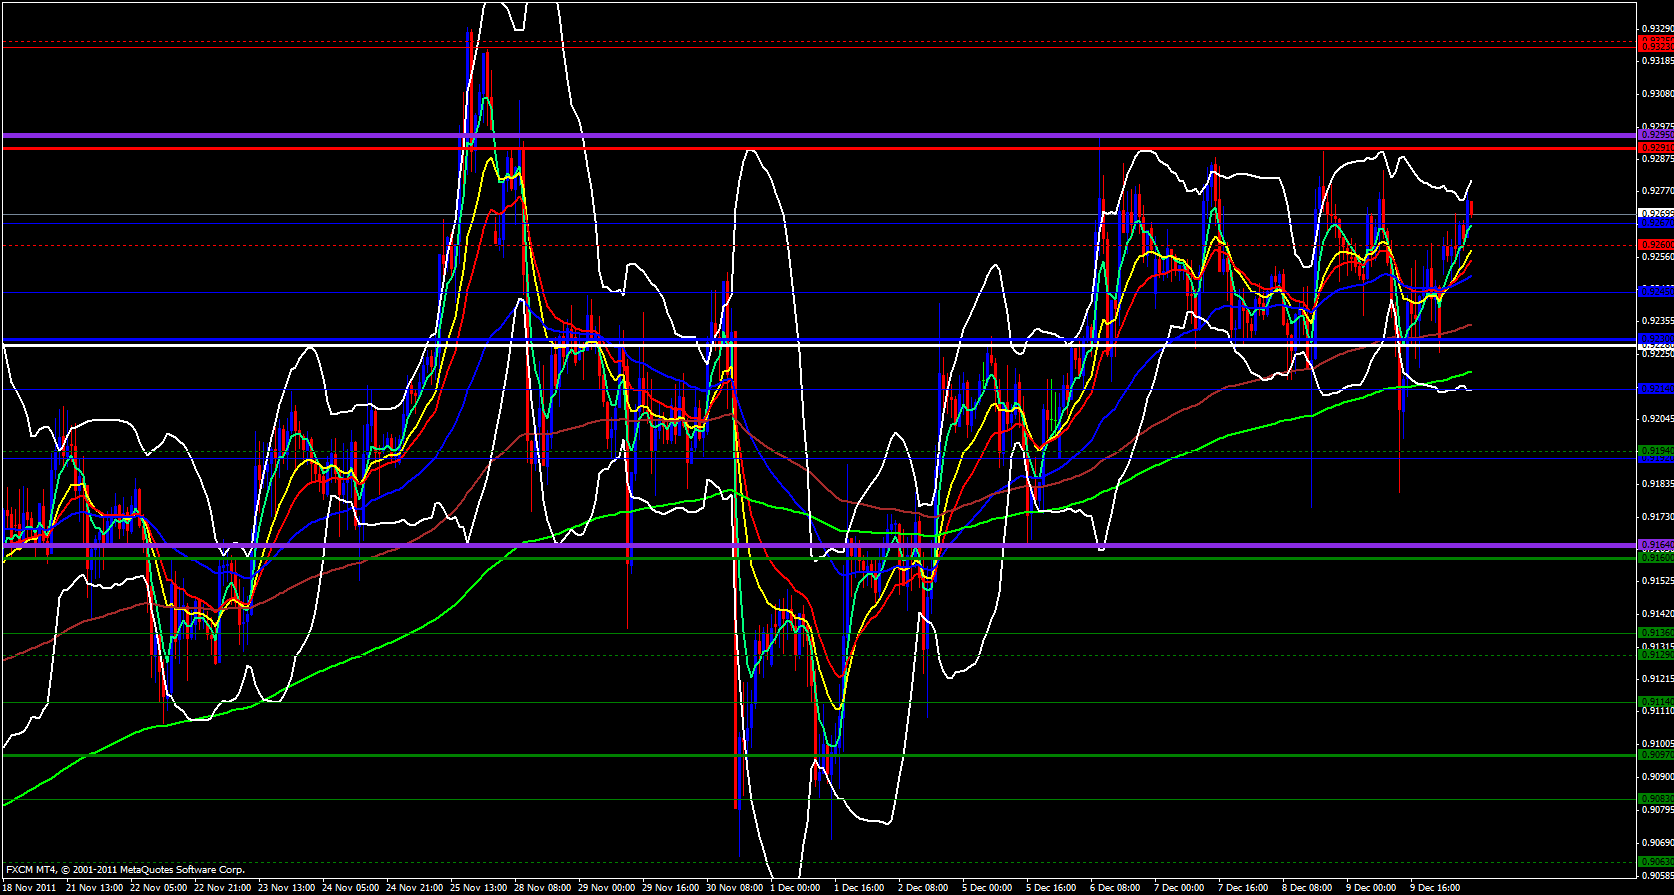
On the hourly time frame I am looking at the weekly R1 pivot which is at .9291 and has been respected about 4 times previously. This about where I would expect some decision making to take place. Will price break above .9295 so we can look for longs or will it bounce off and head back down to .9230? More than likely I will expect price to bounce off the region between .9295 then head back down.
The daily R1 pivot is at .9278 and .9284 was last Friday's high however, on the 15 minute time frame price is swing fibbing its way up and riding the ema's to the upside. So I guess we will have to see if price breaks above .9285 or better yet, above .9300 I would be watching for further upside otherwise, this could be the area where price could start to switch bearish. So watch the .9300 level very closely.


