By: Colin Jessup
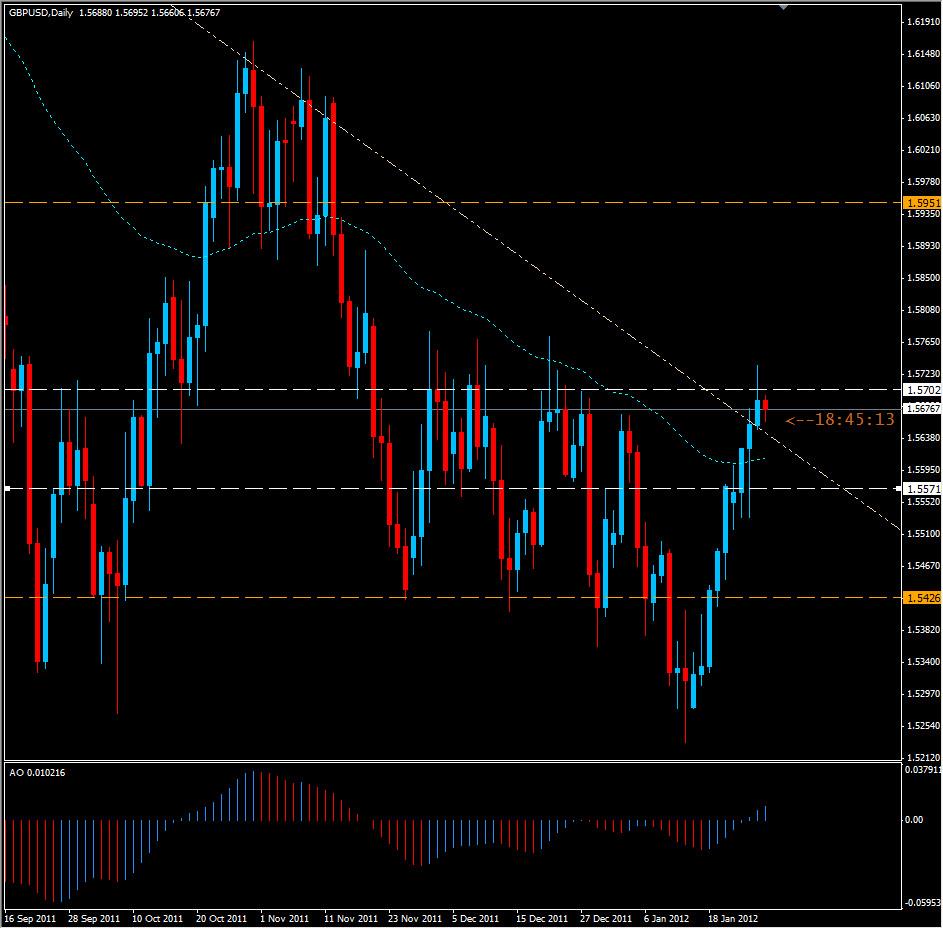
The Sterling pushed its way through the daily moving average that was noted to be a key level in my previous article on the pair earlier this week, but hit resistance at 1.5734 and closed at 1.5688. No surprise to traders who follow previous support & resistance zones as the pair has had trouble in both directions around the 1.5700 zone. The pair also broke a descending trend line and Bullish volume is suggesting this resistance could be tested again before the end of the week. Breaking and closing above the 1.5750 level is key as price has reversed at this level 8 or more times since November 2011 alone. Resistance levels to watch will be 1.5700/1.5750, 1.5850 and 1.5900 with Support levels below of 1.5625, 1.5575 and 1.5480. Also worth noting is that the Monthly chart candle is drawing to a close soon, and as it sits right now appears to be indicating a Bullish continuation, but volumes on the monthly charts are slightly bearish...for traders who went long on the pair earlier this week there have been some nice profits, but probably not the best area to enter a long position if you intend to hold it more than a few hours. This is the perfect time to cover and hold for higher prices, but it may take some time to reach the next zone of 1.5150. I am Bullish on the Sterling...


