By: Christopher Lewis
EUR/USD
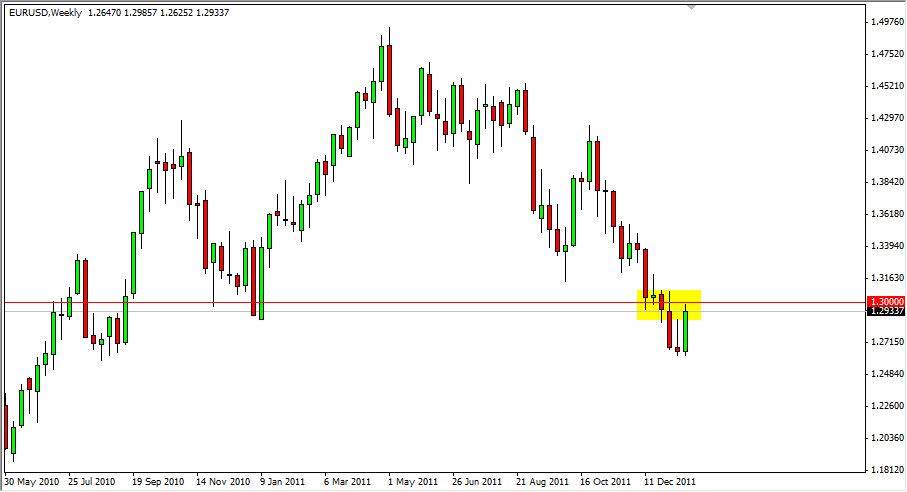
The EUR/USD pair looks like one that will continue to bounce around in the range that it has been stuck in lately. While the world waits to see if the Greeks can come up with a “voluntary solution” to be put in place for their bond holders, the markets will probably sit in a range. However, there is one area to watch closely: the 1.30 level. If this area gives way to the upside by virtue of a daily close over the 1.31 mark, this pair will probably get a bid to 1.35 or so. Having said all of that, the issues in Europe are structural, and aren’t going away anytime soon. But we must admit that the nature of this pair suggests that a rally will be forthcoming soon so the bulls can have their say. Selling is still preferred overall though, and signs of weakness are what I am looking for. The pair is so volatile, there is a good chance I will ignore it for the week as there are other charts that are much more appealing.
AUD/USD
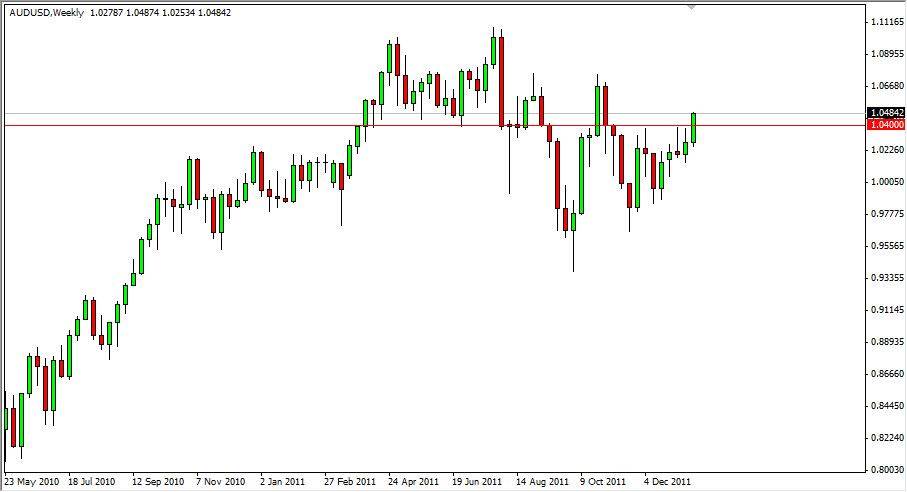
One of those more appealing charts is this one. On Friday, the Aussie smashed through major resistance and finished strongly. The breaking of this level, 1.04, is actually a breaking of a daily triangle that should see this pair run to 1.12 before it is all said and done. The Chinese are about to ease a bit, and this almost always means Chinese buying of minerals and hard assets from commodity-rich Australia. The Aussie is one of the strongest currencies suddenly, and this trend should continue. (If you look, while the Dollar was gaining over the last month, the Aussie was still grinding away to the upside, a very strong sign.)
USD/CAD
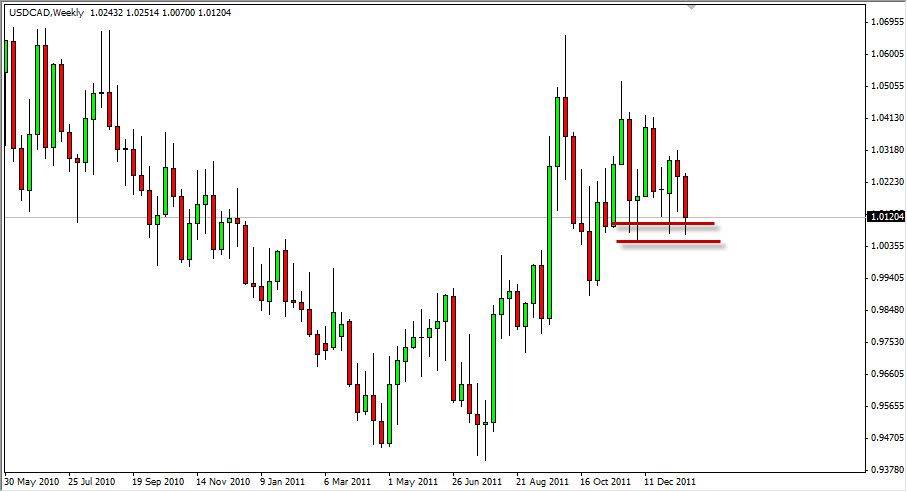
This pair is ugly. I really cannot describe it any other way at this point. It does make sense though, as the situation in Iran has the oil markets on edge, and this will always work for or against the Canadian dollar. With the oil markets falling, it is hard to tell – but it normally means a higher USD/CAD rate. However, the USD is showing signs of weakness in several markets at the moment, and the /DXY (Dollar Index) is looking like a reversal waiting to happen. In other words, this pair will continue to grind aimlessly. Watch the parity level though, if it gives way we could see some downside movement.
GBP/USD
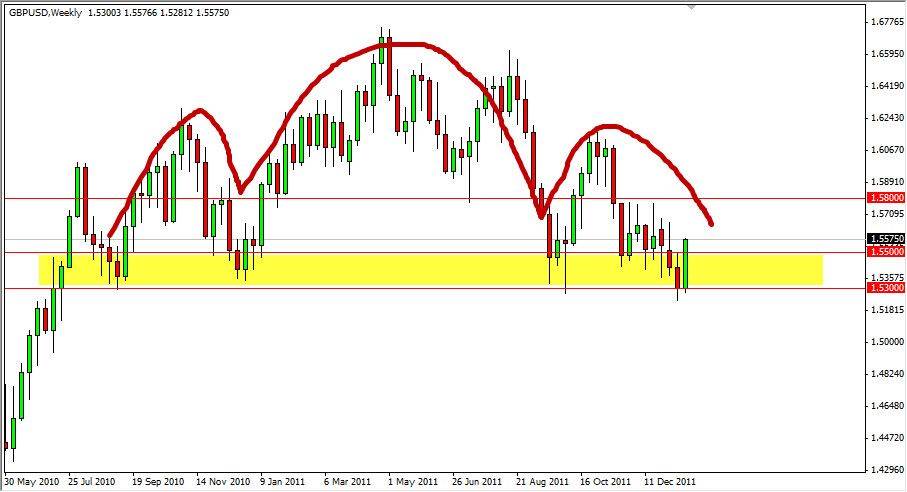
This past week could have seen a massive (complex) head and shoulders pattern get broken to the downside in the cable pair, but instead we had a large amount of buying at the 1.53 level. The yellow box on the chart shows the “neckline” of this pattern, and it still could give way. But to be honest, this last weekly candle has me thinking this pair wants to run back to the 1.57 – 1.58 level, which I have marked as the next resistance area. The trend is still down overall, but the bounce should be respected. However, if there is a reversal and a close below 1.53 - I am selling this pair hand over fist until we hit 1.40 or so. (This could still happen, but looks like a rally will have to be had first.)
NZD/USD
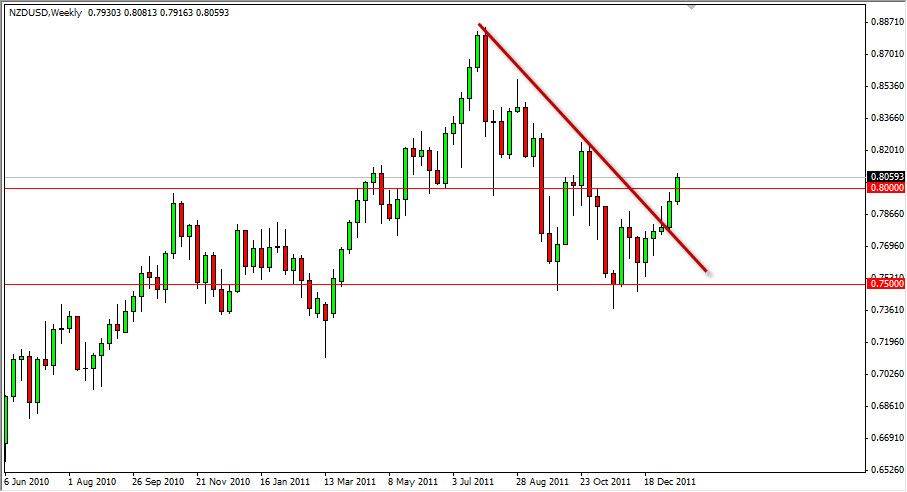
Kiwi dollar got a nice boost over the past week, and like its antipodean cousin the Aussie, has been grinding higher in the face of Dollar strength. The breakout above the 0.80 level is essentially the same thing as the Aussie breaking over the 1.04 level – it is going to rise overall. The Kiwi has broken well above the 0.80 level and the downtrend line – both reasons to own this currency. As long as it stays over 0.80, you really can only be flat or long.

