By: Fadi Steitie
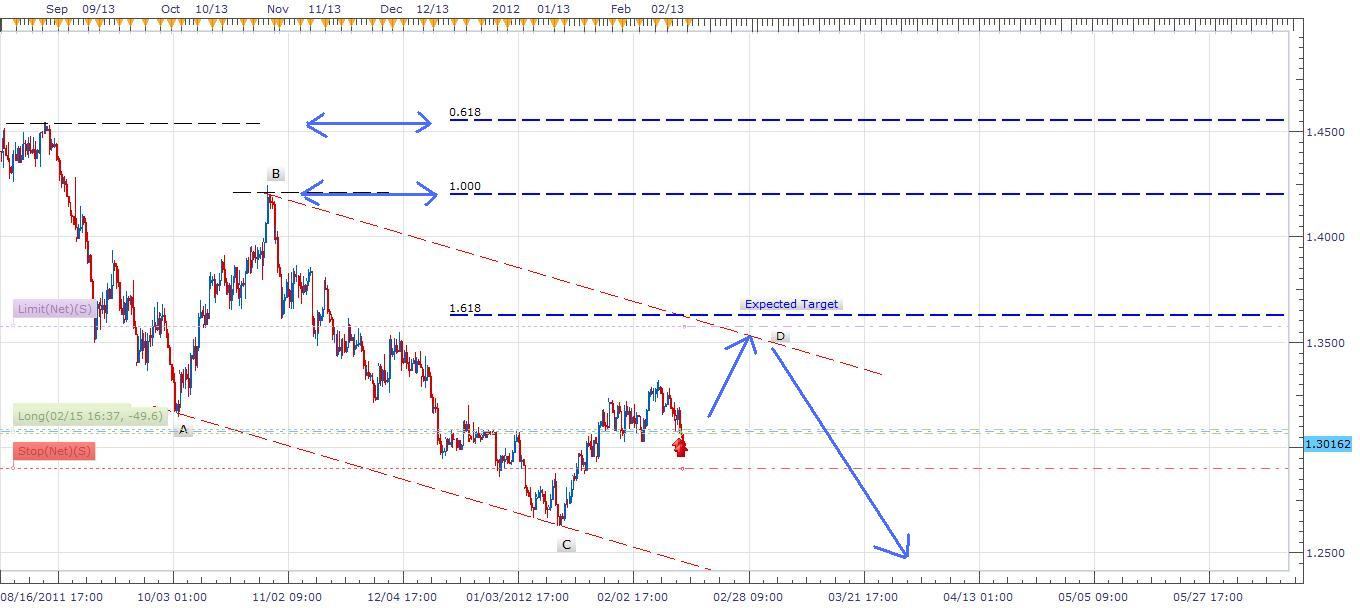
I have attached a larger chart scale for EUR/USD to show the Golden Ratios relationship. As a falling diagonal or whatever pattern is in a downside progress, each support and resistance usually hits .0618 fib level, and wave marked D is in progress until it hits its resistance and the major fall will follow in order to complete the pattern. However, all this analysis are based on theories just to limit market uncertainties. Probability is so open and any move is expected. I am long now and watching the economic news to confirm my thought on the pair.

