By: Colin Jessup
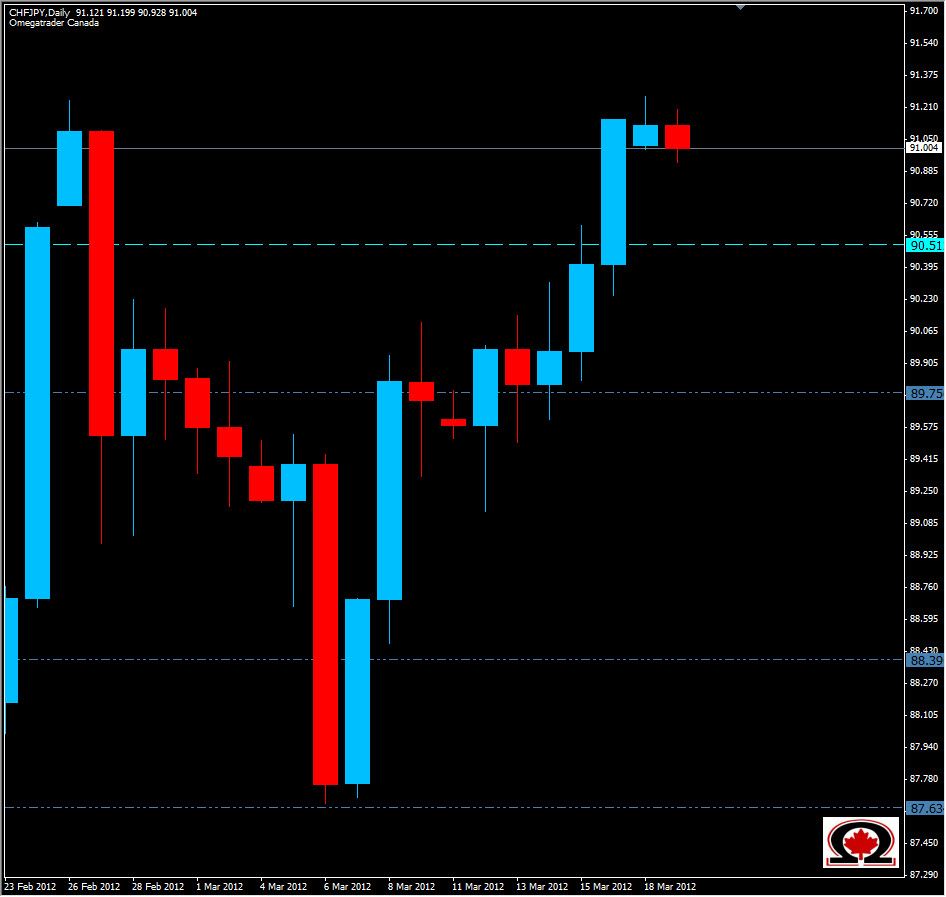
At the start of every week, I have a look at weekly charts to get a feel for the potential market direction. While there are many interesting candle formations across the multitude of currency pairs this week, I am especially interested in the CHF/JPY. This pair formed a 'Hammer' formation or 'Hanging Man' as some know it at the end of last week, but these are often psyche-outs without confirmation...tricking traders to jump in if price breaches the high or low.
Adding this past week's full bodied Bullish candle is that confirmation. This pair is potentially setting up to move much higher after breaching the high of the week of October 30, 2011 at 91.395. The pair has already breached the most recent high at 91.247 from February 22, 2012 by 2 pips. While the daily chart shows a possible 'double top' forming, the trend is strongly bullish on this pair and trading above the Weekly R1 at 91.87 should confirm this. We have a roughly a 600 pip technical vacuum above 91.40 and as most traders know, price almost always fills the vacuum eventually. On the way up there will also be resistance at 92.63 and 94.00 with support below at 90.50, 89.75 and 88.39.

