By: Colin Jessup
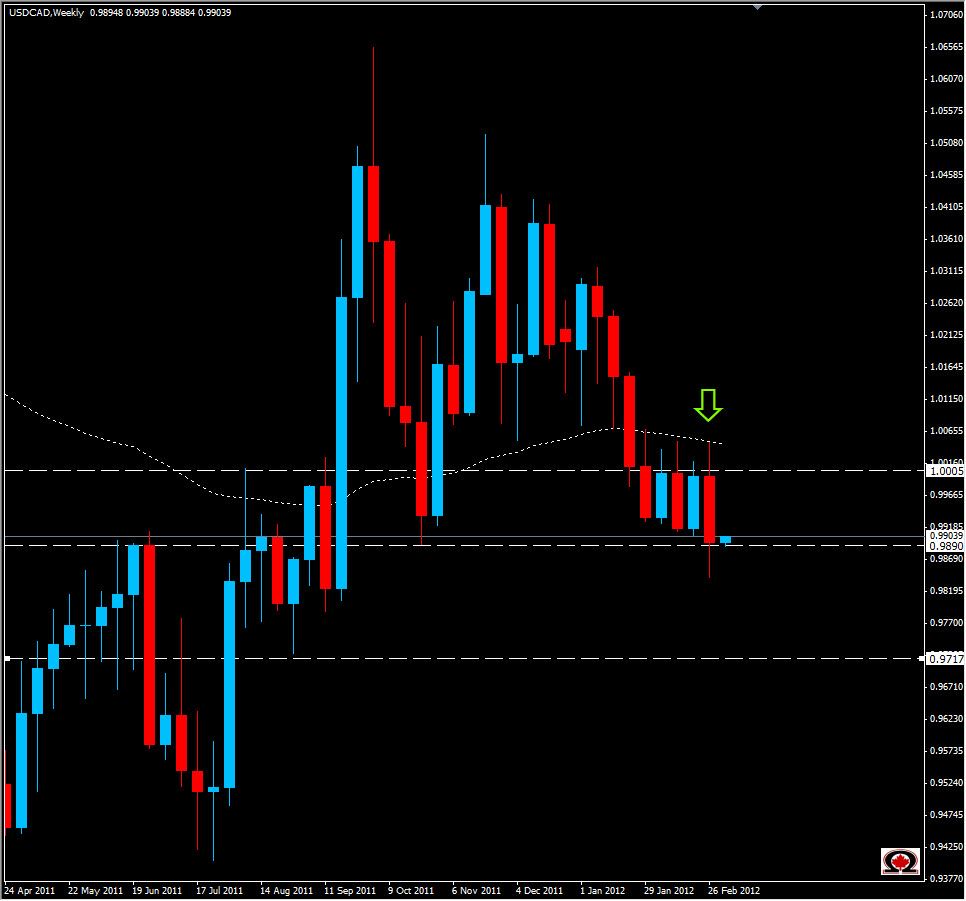
At the end of each week of trading, I like to take a look at the weekly chart to see where the currency pairs might be heading. This week, there are numerous weekly charts showing Bearish continuation, or reversal patterns...and the Loonie is a great example. This can also be considered a follow up to last week's post on the same pair.
Price opened last week at a daily resistance zone of 1.0005 and quickly tested the weekly EMA at 1.0050 that very day. Thats where the Bulls lost the race however and the Canadian Dollar finished stronger than its southern cousin the Greenback closing at 0.9895 after pushing as low as 0.98412. For 5 weeks in a row, price has been making lower highs, and lower lows for the most part, indicating a bearish breakout, or continuation was imminent. While price is slightly bullish late in the Tokyo trading session, this possibly supports falling prices on the USD/CAD chart later in the UK/USA sessions. There will be some minor support at 0.9870 and then 0.9824 before hitting 0.9720 support. If the Bulls gains some traction, look for resistance at 0.9880, & 1.000. Above 1.0050 we could possibly see a shift to bullish price action, but it is more probably that we will see price return to mean, then fall once again. I will be watching this pair closely when the New York session opens, and am strongly Bearish on the pair.


