By: Colin Jessup
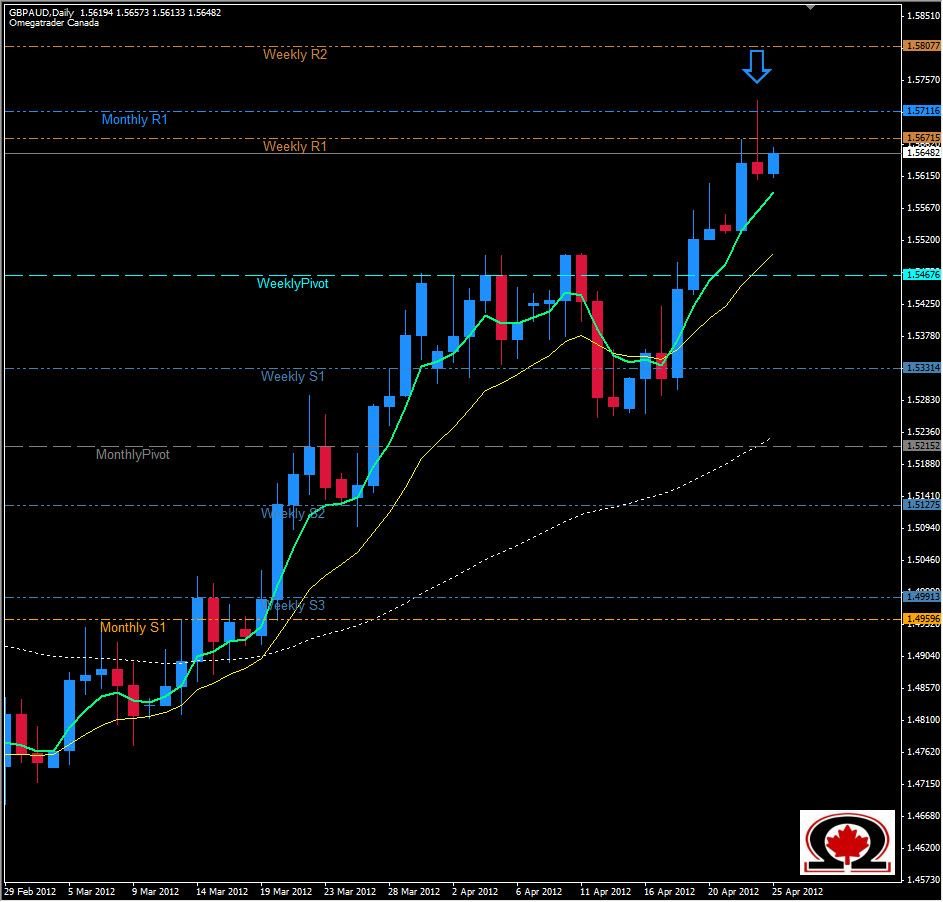
The GBP/AUD daily chart printed a Shooting Star formation at a strong area of Resistance that includes the Monthly R1 at 1.5712 and the Weekly R1 at 1.5672. The tail of the candle shows that the Bulls were still in control for most of the day until the Bears took over and forced the prices lower, closing lower than opening. Considering the zone that this formation printed at, this could be a hint that price is set to reverse. With support levels below being almost non-existent, there is a nice technical vacuum for the pair to fall into below 1.5615 and reaching the Weekly Pivot at the 1.5470 level. If price does head lower, look for minor support at 1.5615 and the Daily S1 at 1.5577 to slow your descent.

