By: Christopher Lewis
The USD/JPY pair has been one that I have followed quite a bit over the last several weeks. After a massive breakout, we have seen a relatively slow grind lower from the highs. The pair got a boost from the Bank of Japan and its asset purchase program. In doing so, the Japanese are effectively “printing Yen”. As a result, the pair rose.
Also, the Federal Reserve recently released the minutes from its last meeting, and there was no real mention of easing in it. The markets have assumed for some time that the next round of quantitative easing was almost a foregone conclusion. The fact that it was put in doubt only fueled this pair’s ascension over the last several months. However, the recent pullback has traders asking a lot of questions.
80, 50, and 200
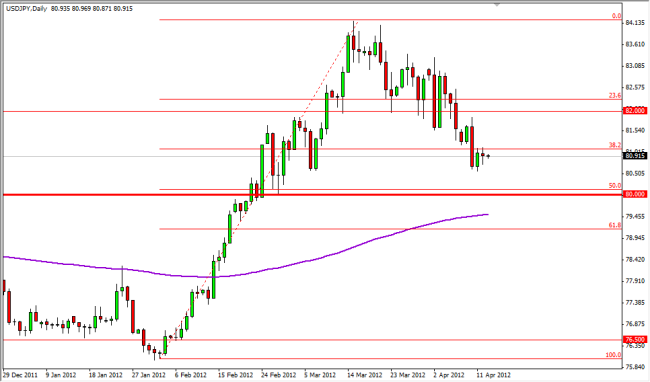
The 80 handle is just below, and was the site of a significant breakout in this market. Because of this, it is a prime candidate for a breakout and retesting for support, as is stated in classic technical analysis. The area is also supported by the 50% Fibonacci retracement level as well, and this should make it even more supportive. However, there is more: the 200 day exponential moving average is just below too. In other words – this is a massive support area just waiting to happen.
The breakout was not only of the 80 level, but a massive trend line that kept pressure on the market from the financial crisis a few years ago. The fact that the trend line broke, the 80 level gave way, and the moving averages starting crossing below – there is a lot of reasons to think that the market should continue to rise over time.
However, it should be noted that the pair saw a massive trend change back in 1995 that looked very similar to this. Quite often, these trend changes will be very sloppy. Because of this, it pays to “keep your eye on the ball” as it were, and look for opportunities that actually mean something. In my opinion, the 80 level looks like a great area to find support in which to go long on.

