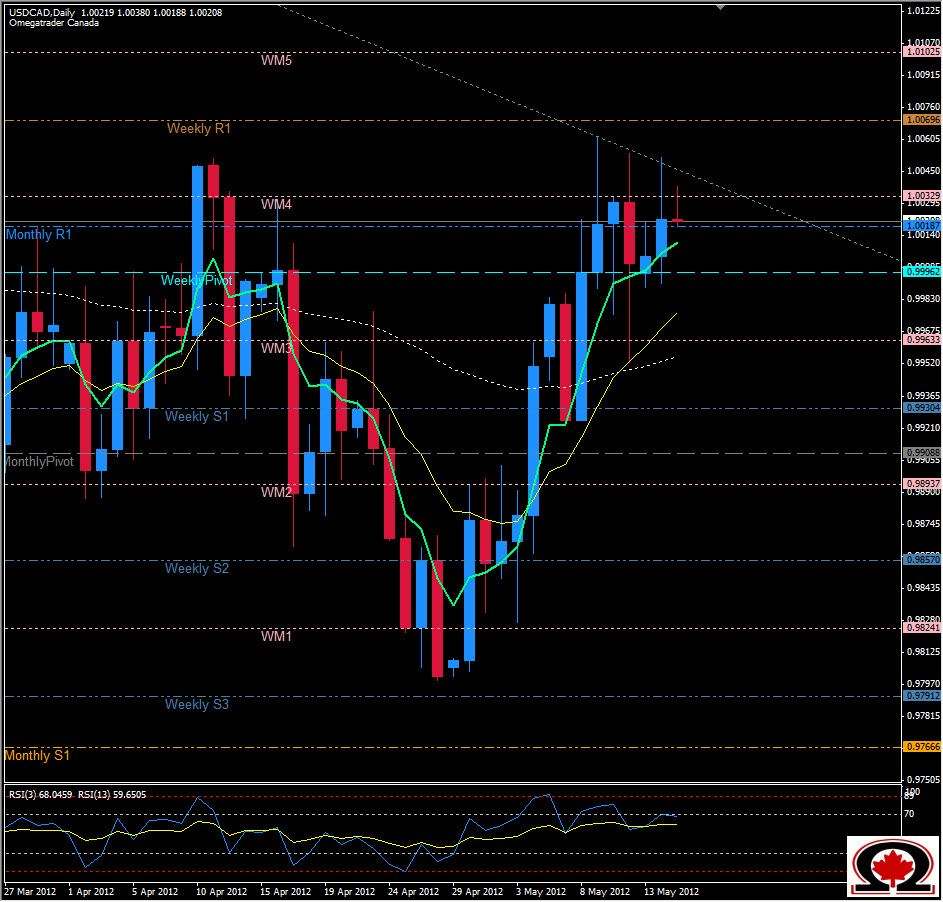
The USD/CAD Daily Chart is, in my opinion a bit of a mess. Not anywhere near as bad as the EUR/CHF 1 Hour chart that resembles a seismograph detecting tremors in the earth, but still a mess. Almost every candle has a long wick at one end or the other, indicating real uncertainty in either investors in the CAD or the USD or both. The Greenback has been attempting to gain on its northern brethren since falling below 1.004 back in January of this year, but a slightly more stable economy in Canada has kept its feather themed currency stable as well, while the Greenback has suffered almost as many challenges as the EURO...almost. Price has been attempting with mixed results to break above 1.006 and has traded for the past 5 trading days in a range of more or less 75 pips.If the Greenback can build some steam and get a close above 1.0035 it might keep going past the Weekly R1 at 1.0069 but first it will need to break a descending trend line at around 1.004, and actually hold above it for more than one day. With a series of almost equal highs but much lower lows, it is possible that the pair will head lower rather than higher and if so will encounter support at the Monthly R1 (1.0019) and the Weekly Pivot (0.99962). Below the WP, 0.9963 will be the next level of support and also brings the 63 EMA into play as support at this level.

