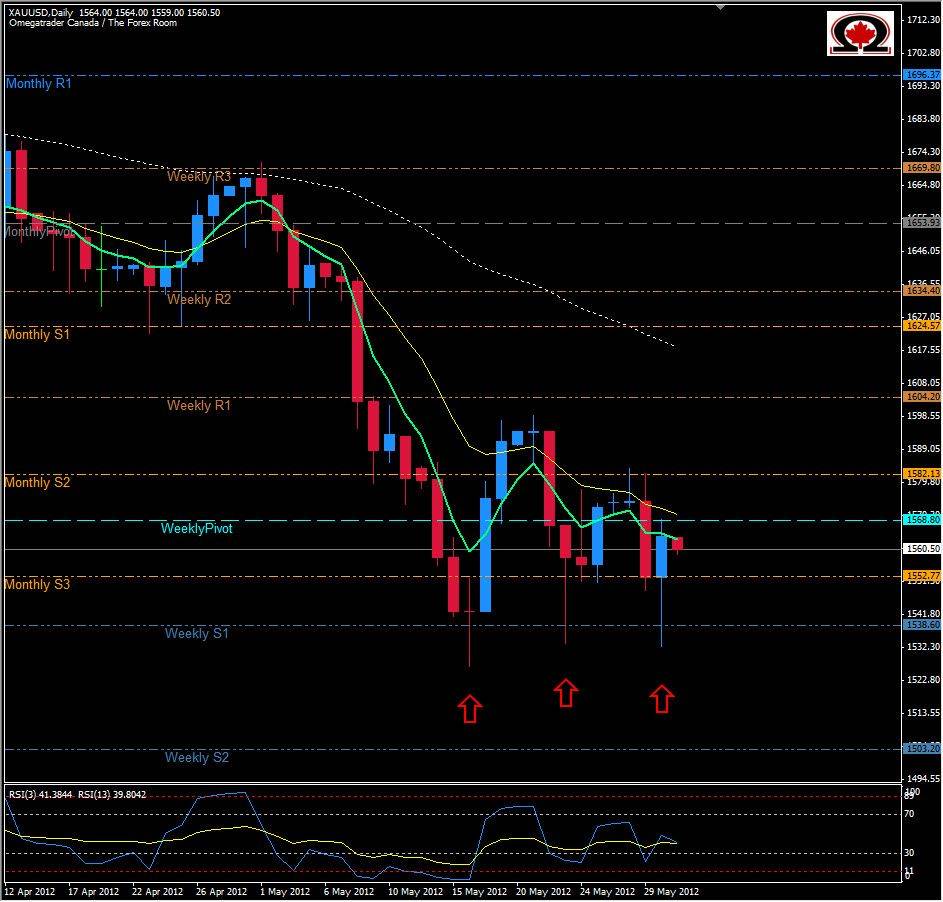
Gold had already tried 2 times in the last 2 weeks to break lower than 1526.90, and tried again in yesterday's trading wicking as low as 1532.60 but was unable to hold prices at this level and closed the day much higher at 1569.10. Looking further back on a weekly or monthly chart we see that the pair has indeed tried a total of 5 times now to break this strong level of support. The problem for the bears seems to be the support level between 1538.60 & 1550 that continues to hold the pair up. From the candle formation we printed today, and the past failed attempts to break lower it is likely we will see this pair trade higher in the next 66 hours (market close). Resistance for the Bulls trying to push the pair higher sits at 1568.80 as a Weekly Pivot, and 1582.13 which is the Weekly R1. The 2 week high will also offer resistance at 1599 especially since it is just shy of the pshycological level of 1600. If the pair does press lower in the hours to come, look for support at 1552.77 in the form of a Monthly S3 and 1538.60, which is the Weekly S1. The Weekly S1 holds the fate of the pair in its hands...a close below this level on a daily time frame or higher will surely give the bears the strength they need to break through such a strong barrier, possibly taking the pair down to 1478 or even 1420.

