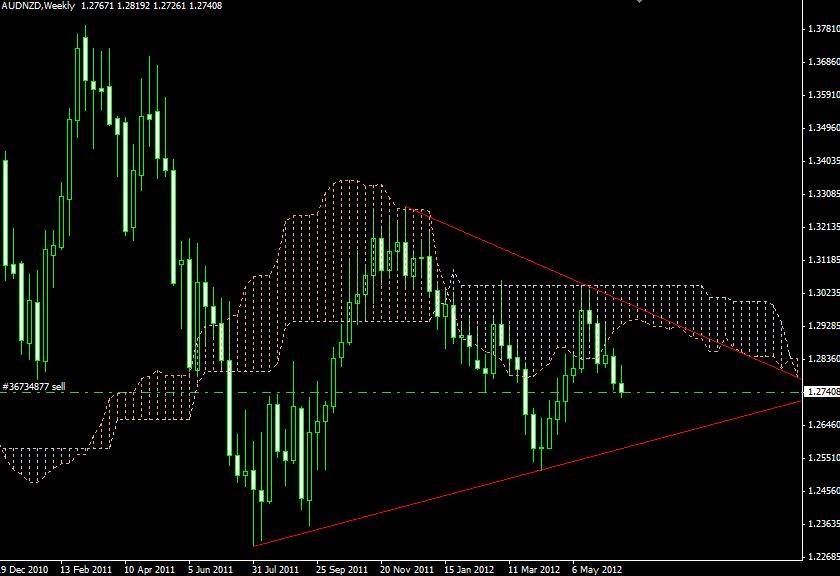
Currency: AUD/NZD
Trend Expected Direction: Down
Method: Ichimoku, Technical Analysis
Description: AUD/NZD daily chart shows that the pair will continue its bearish sentiment. The pair, once again, closed below the kumo (clouds) and formed a bearish engulfing candle. H4 chart also indicates a downtrend. The pair like to head towards the lower band of the triangle formation we see on the daily-weekly charts. Once the price hits 1.2700, you may move stop-loss to the entry point.
Recommendation: Short
Target Area: 1.2620
Stop-Loss: 1.2805

