Start Trading Now Get Started
Table of Contents
Affiliate Disclosure
Affiliate Disclosure DailyForex.com adheres to strict guidelines to preserve editorial integrity to help you make decisions with confidence. Some of the reviews and content we feature on this site are supported by affiliate partnerships from which this website may receive money. This may impact how, where and which companies / services we review and write about. Our team of experts work to continually re-evaluate the reviews and information we provide on all the top Forex / CFD brokerages featured here. Our research focuses heavily on the broker’s custody of client deposits and the breadth of its client offering. Safety is evaluated by quality and length of the broker's track record, plus the scope of regulatory standing. Major factors in determining the quality of a broker’s offer include the cost of trading, the range of instruments available to trade, and general ease of use regarding execution and market information.

EUR/USD Technical View- July 10, 2012

By Fadi Steitie

Fadi Steitie is an entrepreneur, investor and professional Forex trader who shares Forex signals with DailyForex.com based on his keen understanding of the market. His favorite pair is EUR/ USD because almost 40% of traders trade this pair and it does match most of his pattern recognition strategies. He is an expert in Elliot Wave principles as well as Ichimoku Kinko Hyu which he is currently researching. So far he has not seen many English translated books about this method of technical analysis, however he is continuing to read about it and believe this method has as much to give to traders like the Elliot Waves method does. Fadi is looking for the magic behind this principle even though many do not research this trading system.

Currency: EUR/USD
Trend Expected Direction: Flat
Method: Elliott Waves and Fibonacci Levels
Description: My apology for the messy chart! However, in terms of a technical view, I see expanded fifth wave in C leg in a falling Zigzag that broke below falling channel (Red Line) reaching 2.618 Fibonacci level. In zone below the read dotted line is a very high risk area for trading although we see a positive divergence in RSI H1 (Not shown). I used Gann fan to spot falling resistance levels which they look extreme. We need to consider here the behavior of trend and expected pattern follows expanded 5th wave, which I expect an expanded flat that could follow yellow pattern (Look at Chart) hitting red line then falling below minimum level in proximate 0.236% below point (c) and then up in a motive wave that could reach 1.2600 price point. It is too early to talk about the expected target level, but I would suggest traders to keep their eyes open to buy and hold above 1.23500 level to reduce risk and increase probability. I will stay aside and post a follow up just when price move at or above 1.23500.
Recommendation: Consider buying above 1.23500

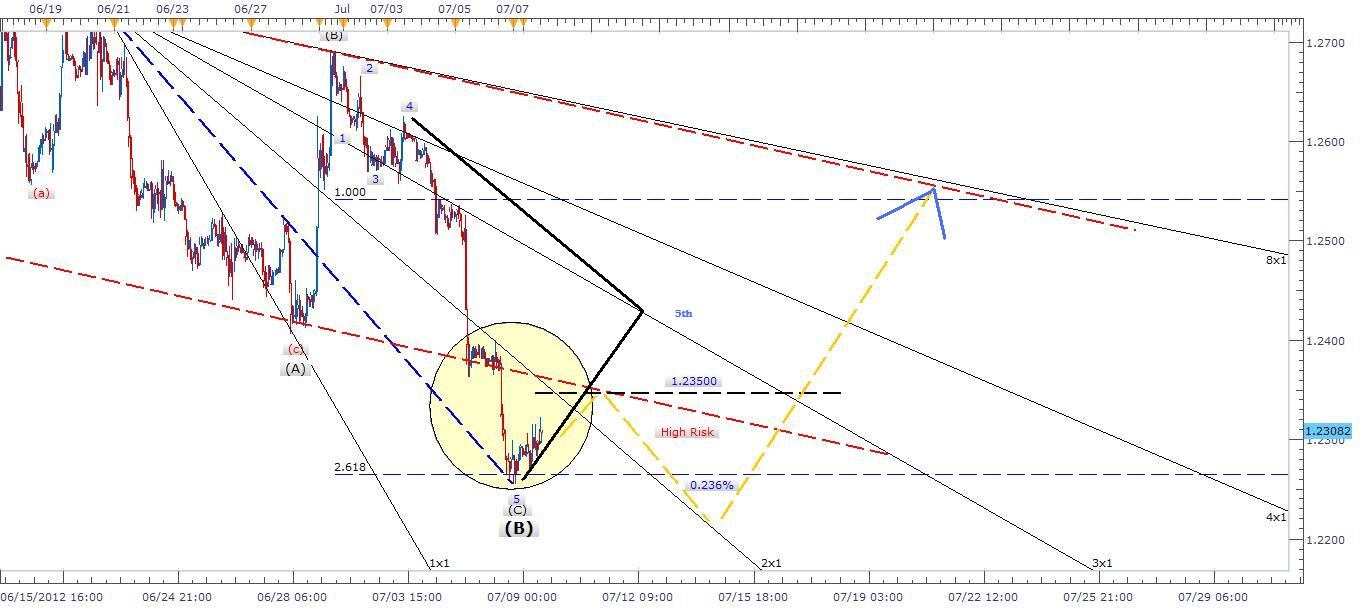
EURUSD Signal 71012

Fadi Steitie

Fadi Steitie is an entrepreneur, investor and professional Forex trader who shares Forex signals with DailyForex.com based on his keen understanding of the market. His favorite pair is EUR/ USD because almost 40% of traders trade this pair and it does match most of his pattern recognition strategies. He is an expert in Elliot Wave principles as well as Ichimoku Kinko Hyu which he is currently researching. So far he has not seen many English translated books about this method of technical analysis, however he is continuing to read about it and believe this method has as much to give to traders like the Elliot Waves method does. Fadi is looking for the magic behind this principle even though many do not research this trading system.

Most Visited Forex Broker Reviews