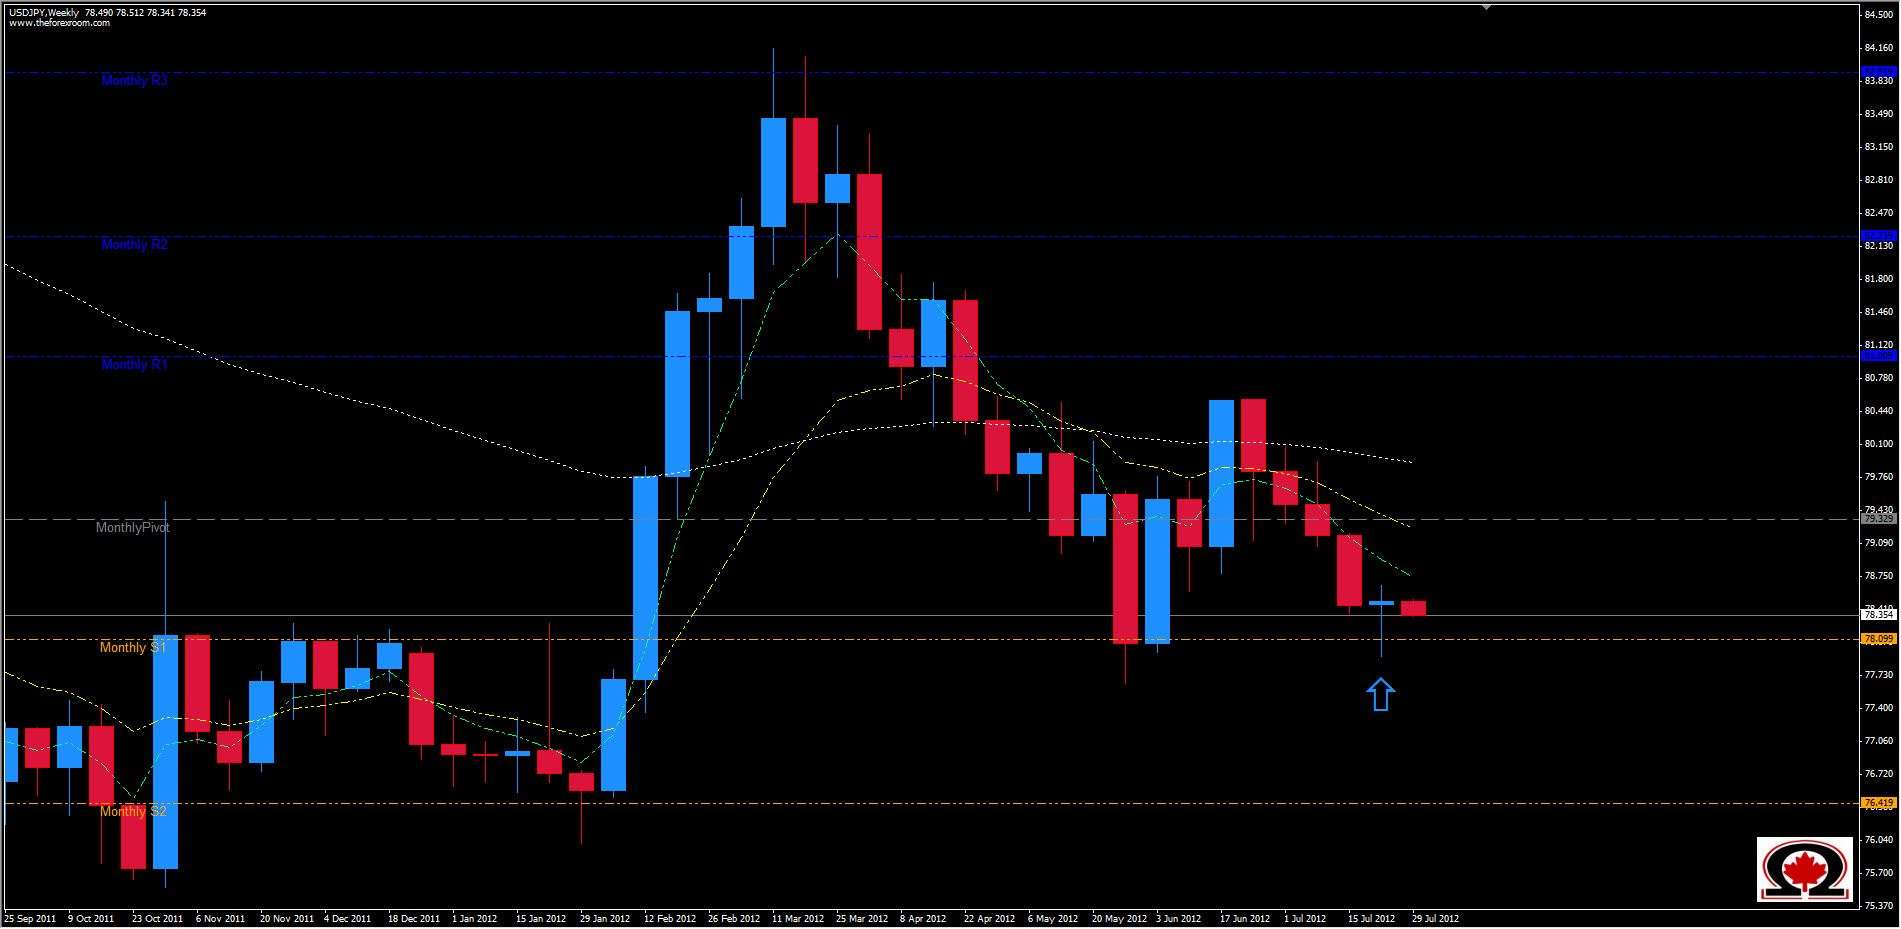
The USD/JPY has been, like the EUR/USD, rather disconnected from the '6 Cousins' when viewed from a market correlation point of view. There are some unofficial rules when analyzing the Forex Markets, one of which is that if the EUR/USD, GBP/USD & AUD/USD all tend to go in the same overall direction, and when they are all going in one direction on a daily chart, then the USD/JPY, USD/CAD & USD/CHF can be seen going in the opposite direction overall. That is not the case with the USD/JPY which has been doing its own thing lately, and last week is a good example. On Thursday & Friday for example, the GBP/USD and the USD/JPY charts were both going up, while the USD/CAD & USD/CHF were both going down. Where the USD/CAD weekly chart printed a strongly bearish candle at the end of the week, the USD/JPY printed a slightly Bullish Reversal candle on the same time frame, indicating that the USD/JPY might be heading higher and the Japanese Yen might be weakening once again against the US Greenback. The candle printed on a zone of support at 78.09 (Monthly S1) which is a zone the pair has struggled with many times recently, from mid July 2011 to February 2012 and again in the beginning of June this year when it hit a low of 77.65 before reversing and rising to 80.559 before once again falling to re-test this region of support. When viewed in a context of the overall trend, it appears to be more of a 'speed bump' than a reversal, and the pair will possibly simply fill the tail after consolidating or 'taking a breath' before heading lower. If the low of the tail at 77.931 is breached, there is roughly a 1500 pip technical vacuum below with only the 77.50 level offering much in the form of support on the way down. If price does break higher there are several Resistance zones on the way up including 78.79, 79.09 & 79.52 with the Monthly Pivot at 79.329.

