Table of Contents
Affiliate Disclosure
Affiliate Disclosure DailyForex.com adheres to strict guidelines to preserve editorial integrity to help you make decisions with confidence. Some of the reviews and content we feature on this site are supported by affiliate partnerships from which this website may receive money. This may impact how, where and which companies / services we review and write about. Our team of experts work to continually re-evaluate the reviews and information we provide on all the top Forex / CFD brokerages featured here. Our research focuses heavily on the broker’s custody of client deposits and the breadth of its client offering. Safety is evaluated by quality and length of the broker's track record, plus the scope of regulatory standing. Major factors in determining the quality of a broker’s offer include the cost of trading, the range of instruments available to trade, and general ease of use regarding execution and market information.

USD/SGD Rejects 1.2150

By Colin Jessup
Colin Jessup is certified in both Securities & Technical Analysis from the Canadian Securities Institute, founder of Omegatrader Canada and a Live Trading Coach at TheTradingCanuck.com, a service that calls live trades to captures dozens of pips daily with low drawdown.

By: DailyForex.com

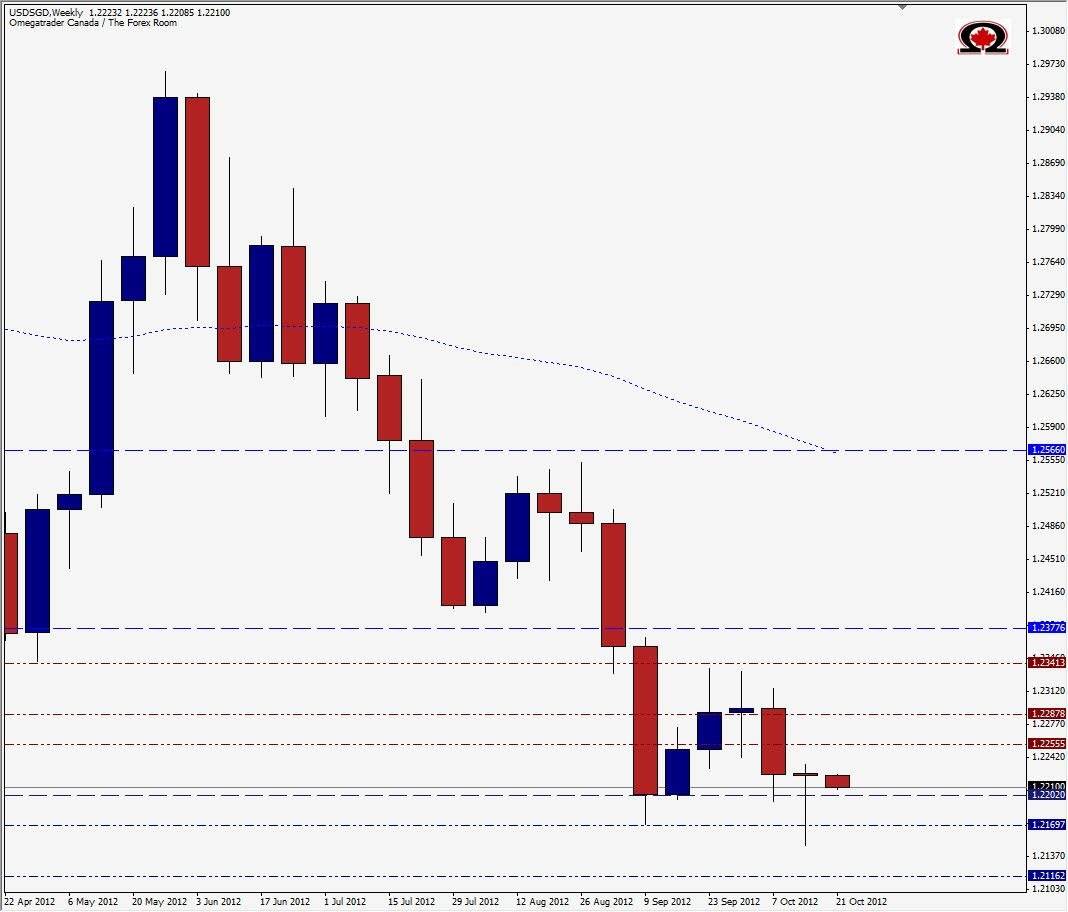
The Singapore Dollar has been gaining on the US Greenback for some time now, hitting an all time high against the Greenback in July of 1.1987. Price has returned to this area after climbing over 1100 pips in August & September and last week attempted to push the chart lower once again but traders rejected the idea, possibly temporarily of a sub 1.2150 USD/SGD with last week's close of 1.2231. The result was a Weekly Pin Bar, or Doji actually. Some call this a 'Dragonfly' Doji because of its long tail. The potential or meaning for traders is basically the same however as it often means price will reverse and head in the opposite direction...in this case, higher.

Although there is not enough data for strong historical support levels to be established below 1.2200, Pivot points along with Support & Resistance levels can be calculated manually to give us something to work with. In this case, Weekly S1-S3's are at 1.2170, 1.2116 & 1.2084 with Weekly Resistance levels at 1.2255, 1.2288 & 1.2341. The Weekly Pivot also sits below the current prices at 1.2201 and is acting as support. While prices are falling slightly during Asian trading, it is possible that a break of last weeks high will bring a Bullish run that will test the Weekly R1 and Weekly R3 while a break of last week's low, 1.2148 could see the pair resuming its Bearish trend to 1.2100 or lower...possibly a retest and double bottom is in store at the 1.2000 area.

Happy Trading!

USD/SGD Weekly Chart - October 22, 2012

Colin Jessup
About Colin Jessup
Colin Jessup is certified in both Securities & Technical Analysis from the Canadian Securities Institute, founder of Omegatrader Canada and a Live Trading Coach at TheTradingCanuck.com, a service that calls live trades to captures dozens of pips daily with low drawdown.
 

Most Visited Forex Broker Reviews