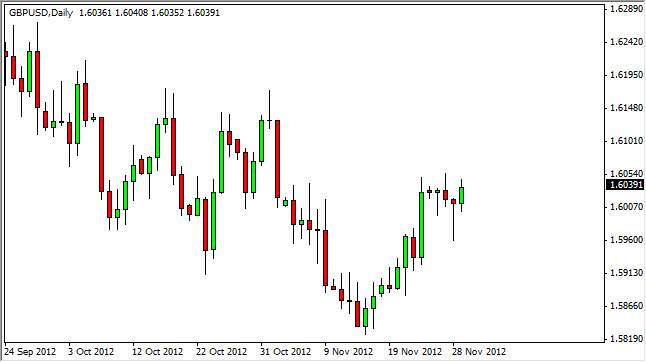
The GBP/USD pair rose during the Thursday session after forming a nice-looking hammer for Wednesday. The hammer sits above the 1.60 handle, so I do find it a very interesting candle from which to base my analysis off of. Looking at this pair, I do find it very bullish and think that we will eventually see higher prices.
I have been long of this pair for a few sessions now, and base my analysis off of the longer-term charts. During the previous move, we had broken out to the upside based upon an ascending triangle that broke out late summer. The 1.58 level was the top of the ascending triangle, and the move that was measured from that particular pattern suggested that we would go as high as 1.63 or so. We did do so, and have pullback since then.
Interestingly enough, the 1.58 level was also the 50% Fibonacci retrace level from the lows of the triangle to the high of 1.63 over the summer. Because of this, the 1.58 level has not only been previous resistance that should now be retested for support, but it also has the Fibonacci traders looking at it as well.
1.58 is the floor
The bounce from 1.58 has me even more bullish in this pair, and I do think that will be the "floor" for the buyers. If we get below that level, this could spell bad news for the bulls. I also like the fact that the 1.60 level is starting to act as support as well, and I do think that a move to 1.62 could be had if we can get above the 1.6050 level. The 1.6050 level is a minor resistance point at best, and I do think that it will be overcome. When it does happen, I think 1.62 will be seen in relatively short order.

All things being equal, I believe that we not only go to 1.62, but I believe we go past the recent highs at 1.63 and beyond. I still believe that sometime during 2013 we will see a print of 1.70 in this pair. With that being said, as long as we are above the 1.58 level I am willing to buy pullbacks.
