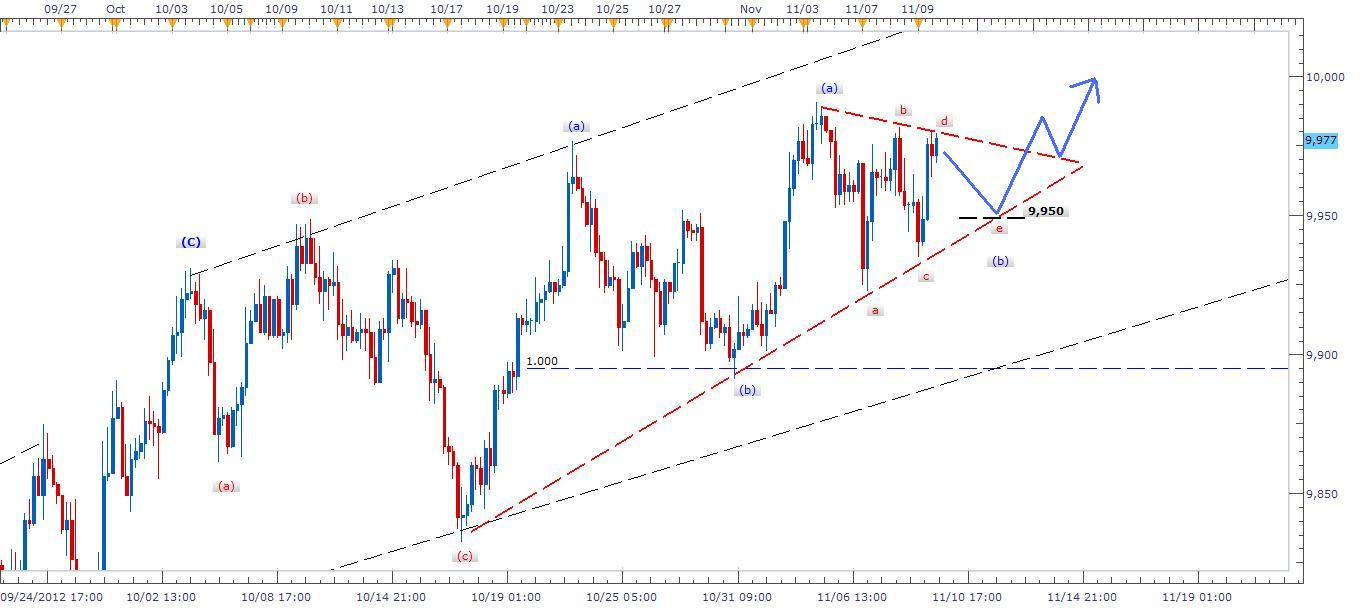
Currency: USD Index
Method: Elliott Waves
Description: Looking at wave pattern for USD Index in upward Diagonal shape after a complex patterns since beginning of 2012, We can notice a barrier triangle within wave (b). The barrier triangle completed four minor waves in a squeeze shape which increase the risk of trading US cross currencies such as Euro, or Japanese yen. However, I do expect one more drop toward 9,950 at 0.764 Fibonacci level before the the greenback trend breaks the barrier at 9,980 toward 10,036. I do recommend traders to set aside and watch the expected breaks both ways or above expected level before trading US cross pairs. I will follow the breaks with potential trades post on Monday or Tuesday.
Recommendation: Watch breaks above 9,980
Stop Loss: N/A
Target: 10,036


