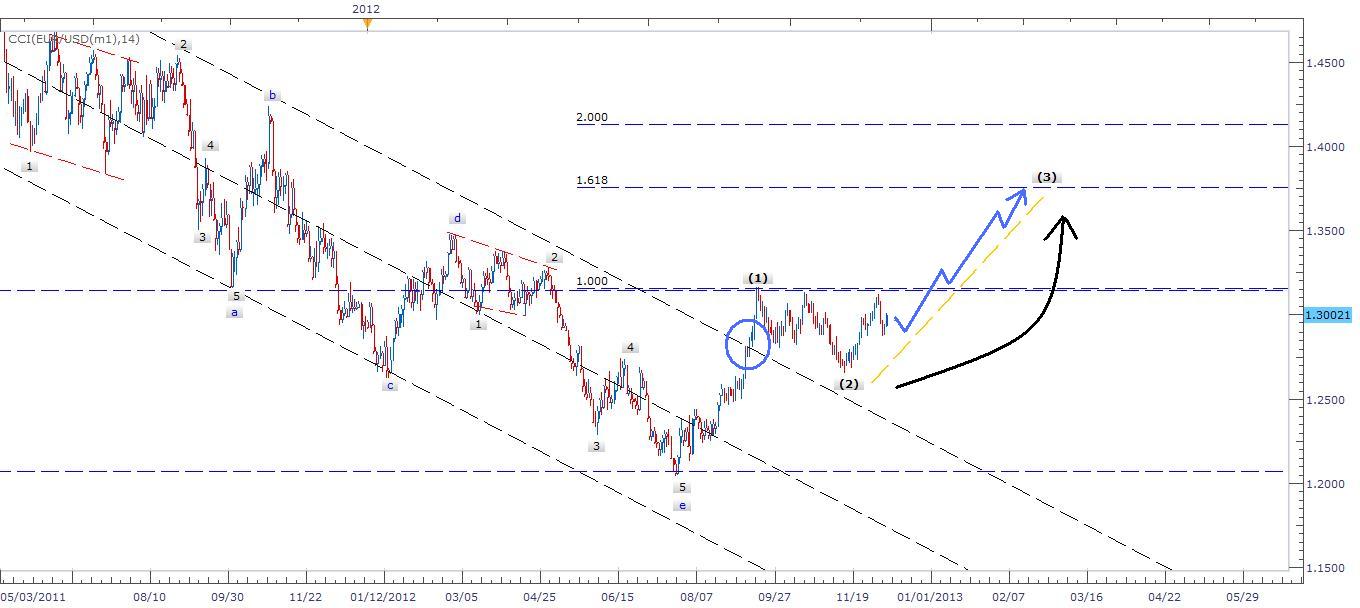
Currency: EUR/USD
Method: Elliott Waves
Description:The projected pattern has completed the second correction started on Jun,7 2010 at 1.18950 and ended on July,24 2012 at 1.20650. The daily chart that I am posting doesn't show the past two years larger corrections, but I wanted to show the break of falling channel for the second correction on Sep, 10 2012 at 1.28111 and a pull back of expanded flat ended at 1.26560 for expected wave (2). Again this is a daily chart that shows a correction in progress which tell me to stay a bit out of the market until it finishes. In general, the trend show a strength and I expect a bullish movement for the pair in the coming few weeks. Within the current correction a +/- 200 pips would take a place before the bull take off. Let watch those 200 pips range and decide when to get into the trend and surf the wave. Stay tuned.
Recommendation: Watch for further trend corrections
Stop Loss:N/A
Target:N/A


