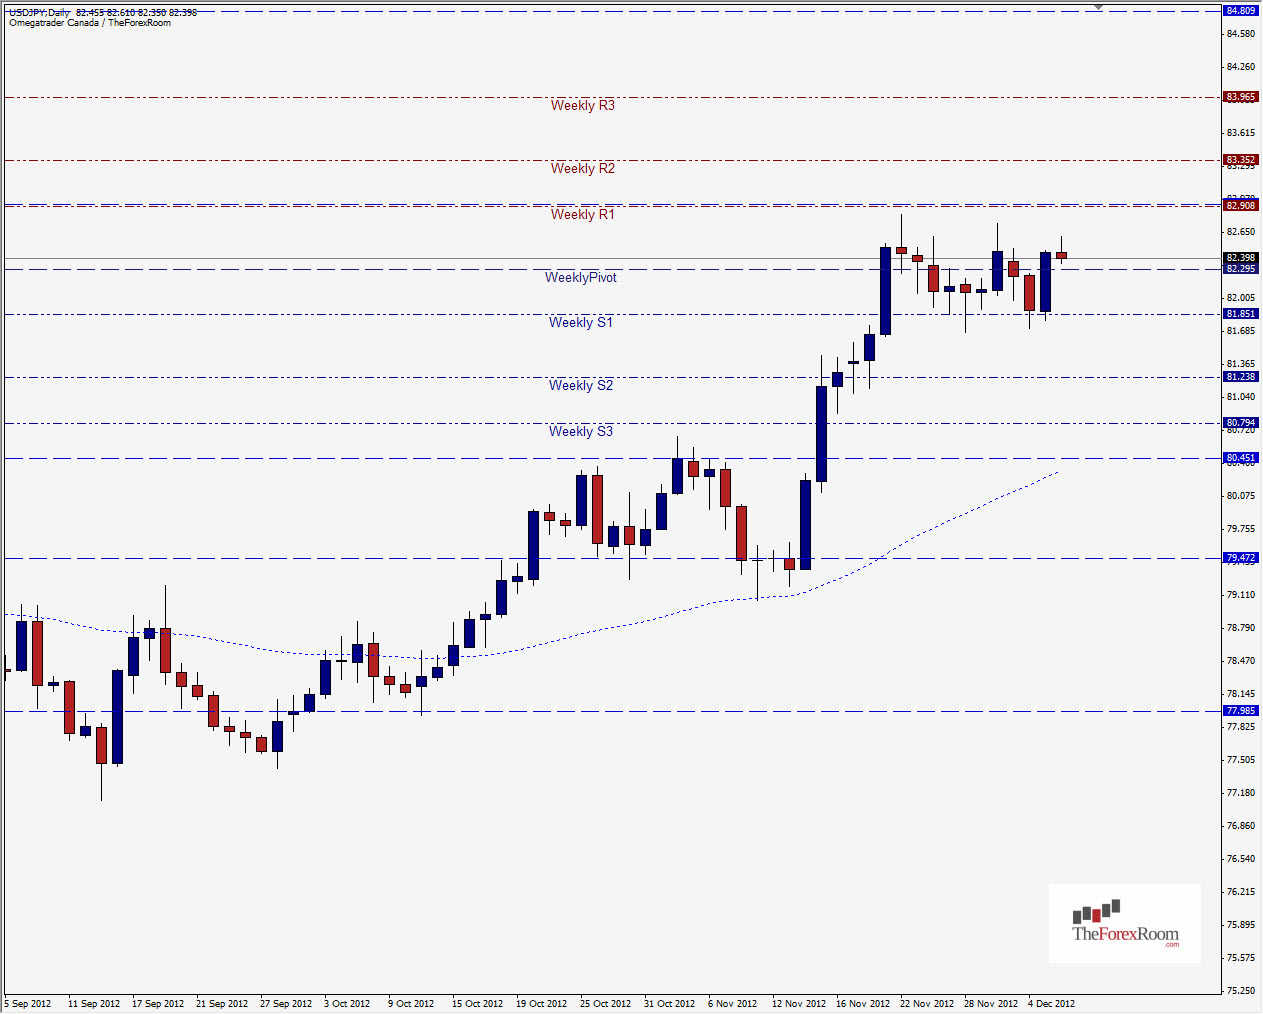
The USD/JPY continues to weaken after a short lived 2 days of being bearish, the pair created a Bullish engulfing candle on yesterdays daily chart that could indicate a pending break of resistance at 0.8290 will be attempted soon. The pair retraced 50% of the distance between November's high of 80.67 and Decembers current high of 82.83 and formed a double bottom at the 50% level/Weekly S1 81.85 yesterday. Looking further back on the Daily charts we see a possible Bearish Head & Shoulders pattern forming, with the current price level potentially forming the right shoulder, but looking strictly at the November/December price action it appears the pair continues to me Bullish. Taking into account the recent statements from the BOJ regarding possible further quantitative easing measures, this pair is both technically and fundamentally Bullish.

To the upside we see Resistance at 82.90, 83.35 & 83.96 with the 2011 highs not out of the question at 85.50. The Weekly pivot is below at 82.24 followed by the Daily S1 at 82.005. Further support below the Weekly S1 of 81.85 consists of the Weekly S2 at 81.24 and string support at 80.50.
Happy Trading!
