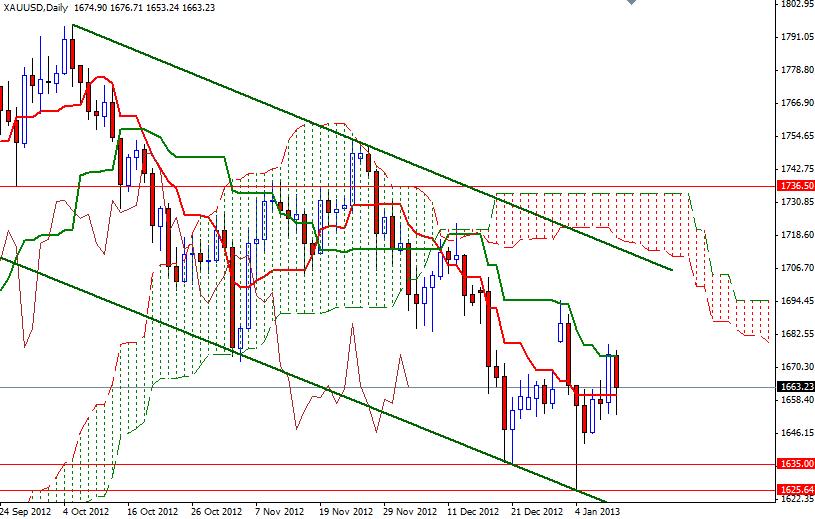
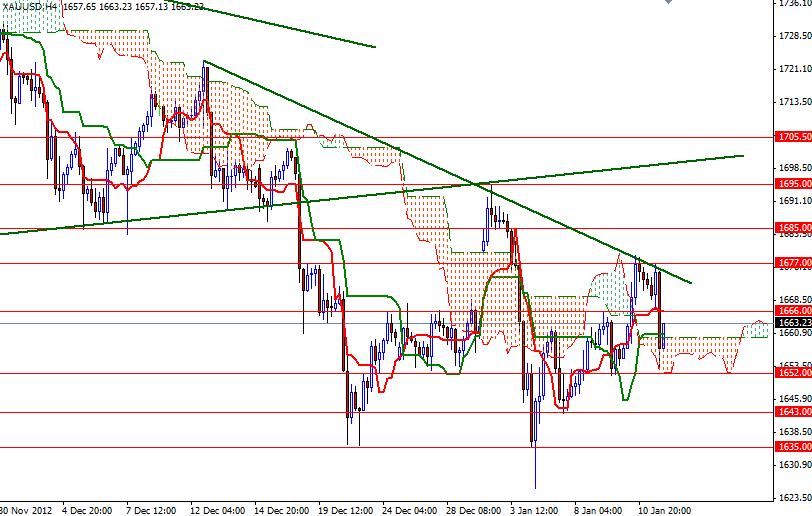
XAU/USD (gold vs. the greenback) had a slightly positive week as the bulls continued to defend the support level at 1652. The pair had accelerated its ascent on Thursday after the China’s trade balance data beat the expectations but the bulls weakened and failed to climb above the first critical resistance level ahead at 1677 after another data out of China on Friday raised concerns that the latest figures could refrain the nation’s central bank from further monetary easing. The recent price action indicates that the war between the bulls and bears intensified in the 1652-1677 zone. Looking at the daily charts from a purely technical point of view, the odds favor the bears in the long term, as long as prices are below the 1705 level at least. On the daily time frame, the pair is still trading below the Ichimoku cloud and the Tenkan-sen line (nine-period moving average, red line) is moving below the Kijun-sen line (twenty six-day moving average, green line). However, we should always keep in mind that markets do not rise or fall in straight lines, so we may see a bullish march towards the upper band of the descending channel, which the pair has been running in since the beginning of October, before the bears pull it further down.
The 1677 level is an area that the buyers have been struggling to get above. If the XAU/USD pair breaks above, there could be a run all the way back to the 1705 level. Above 1677, resistance can be found at 1685, 1695 and 1700. If the pair fails to break and hold above 1666, we could retest 1652. If the 1652 level gives way, expect to see more support at 1643 and 1635. A break well below the 1625 support on a daily close could trigger a sell-off. In that case, I would be looking for 1612. Today gold traders will be closely watching the Fed Chairman Ben Bernanke’s speech on the economy.


