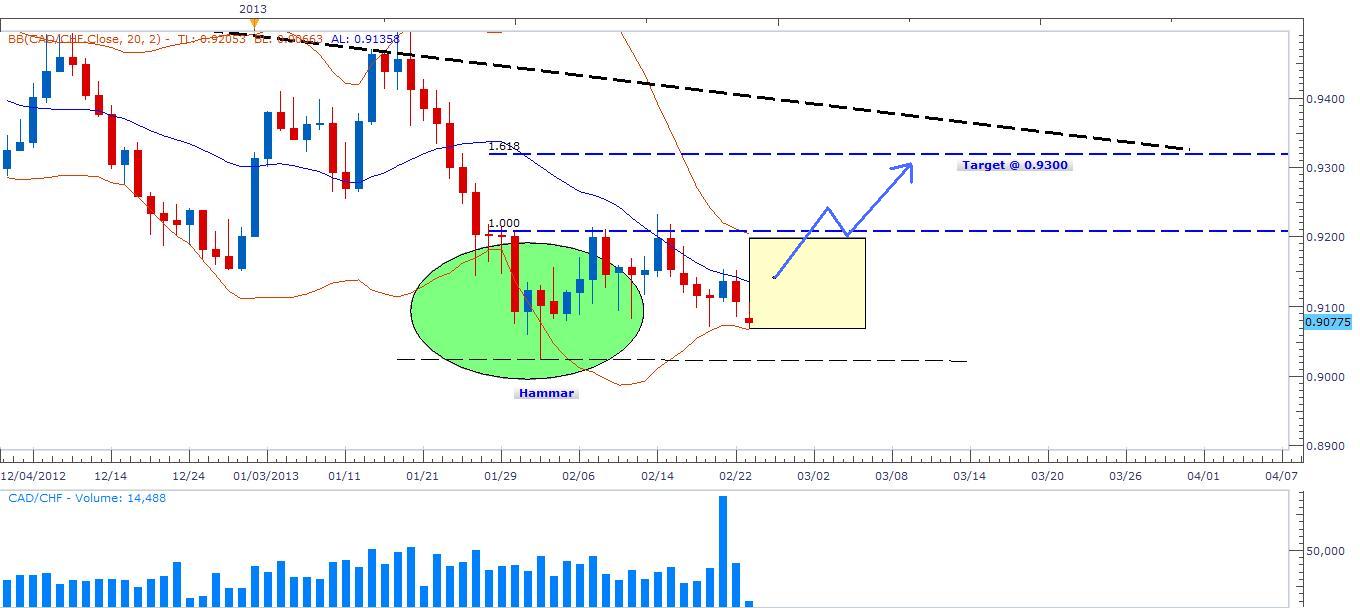
Currency: CAD/CHF
Method: Candle Sticks & Bollinger Bands
Description: Trading the hammer is very rewarding. On this daily chart, a hammer just closed above the lower band on Feb 1 with a double corrections in an action of a pull back scenario followed be a nice squeeze from both bands which indicate breakout on the way. I will watch the trend closing above the blue middle moving average before I trigger a buy bottom and a close above the upper band would confirm the bullish move. The target might be expected at 1.618 Fibonacci level above the resistance of both corrections above the hammer which expected to hit 0.9300 price point level.
Recommendation: Watch hammer effect on daily chart once trend close above the middle blue average and break the squeeze from the upper band.
Stop Loss: 0.9000
Target: 0.9300


