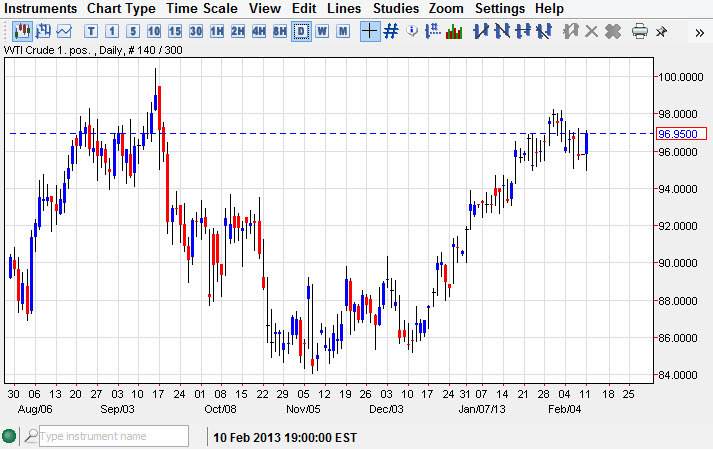
The WTI crude market had a very bullish session on Monday after initially falling. The market found support at the $95.00 level again, and as we have recently; found this market to be willing to buy the contract out of those levels.
Looking at this chart, you can help but notice that we are towards the top, but the bullish move the we saw later in the day on Monday definitely suggests to me that this market is more of a risk to the upside and the downside. I think that the $98.00 level will be tested again, and I also believe that we will eventually break through and heads towards $100.00 a barrel.

Going forward, on a move above the highest from the Monday session, I think that this market continues higher. In fact, that's where I will be buying this contract. As far as selling is concerned, this is going to be a difficult one to do so and as the bullish momentum is so strong although you can definitely see that we are the top of the consolidation area.
Fed fueled bullishness
Forget about economic fundamentals at this point. Commodities in general are enjoying a bit of bullishness simply based upon liquidity. The Federal Reserve continues to pump the US dollar into the system, and as a result it will take more of those greenbacks to buy oil. Because of this, this is more or less a "buy on the dips" type of market going forward, and I do believe that $100 is almost a guaranteed outcome at this point.
However, I don't think that we will go to parabolic or overly bullish of this point simply because there isn't enough demand. Eventually, demand does enter the picture and people have to take it into account. However, in the short term people were mainly thinking about the fact that the Dollar is getting beat up a little bit, and as a result it makes sense to hold hard assets as their better stores of value. Going forward, I expect that the short term charts will offer excellent buying opportunities on supportive candles. This market can be fairly choppy, animal certainly has been recently. Because of this, I believe that looking on the one-hour chart is probably going to be just about the right timeframe.
