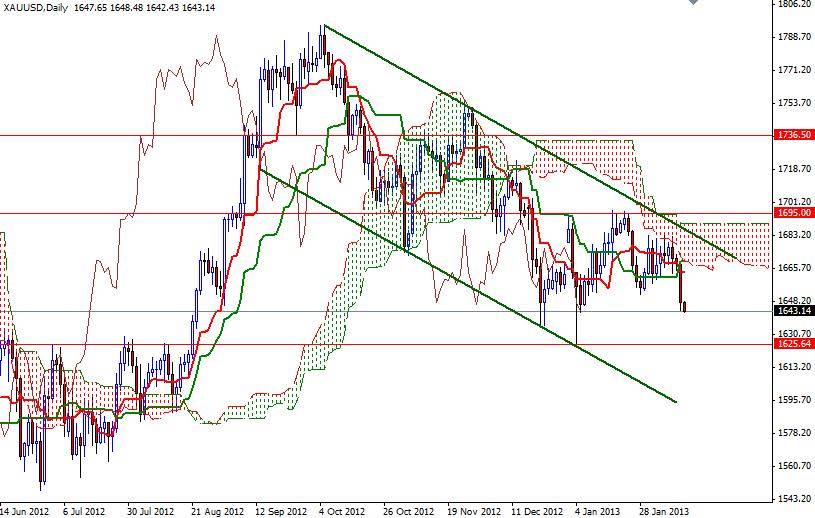
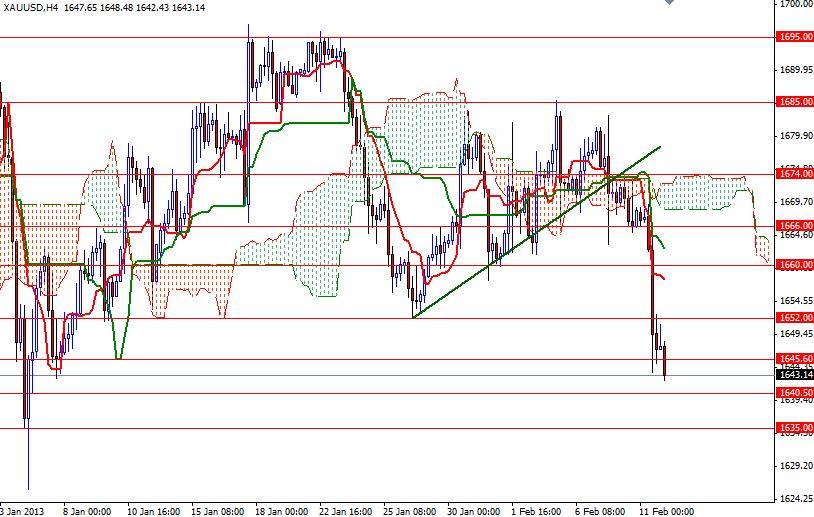
The XAU/USD pair has managed to break and close below the middle line (1652) of a massive consolidation range (roughly between 1525 and 1795) that the pair has been locked in for over 70 weeks. In my previous analysis I had mentioned the importance of the 1660 support level which was the bottom line of the support zone that has kept gold prices in consolidation over the last eight days. Not surprisingly, the pair accelerated its descent once we broke this critical support level. Prices hit 1644 and bounced back to the 1652 in order to retest as resistance. Breaking below the 1660 support was a clear sell signal and I think any bounce towards this level is going to attract sellers. After yesterday's price action, the Tenkan-sen line (nine-period moving average, red line) crossed below the Kijun-sen line (twenty six-day moving average, green line) on the daily chart as well, suggesting a bearish continuation is on the horizon.
Technically speaking, this pair will remain bearish unless we see prices close above the Ichimoku clouds which intersect with the upper band of the descending channel. If the bearish momentum continues, expect to see some support at 1640.50, 1635 and 1625.64. If the fall does stop around 1640/35 zone and price turns bullish, look for resistance at 1645.60, 1652 and 1655.90. The major focus today will be on the U.S. Federal Reserve policy makers and EU Finance Ministers' meeting. Increasing worries about the global economy and growth could lift demand for the highly liquid American dollar.


