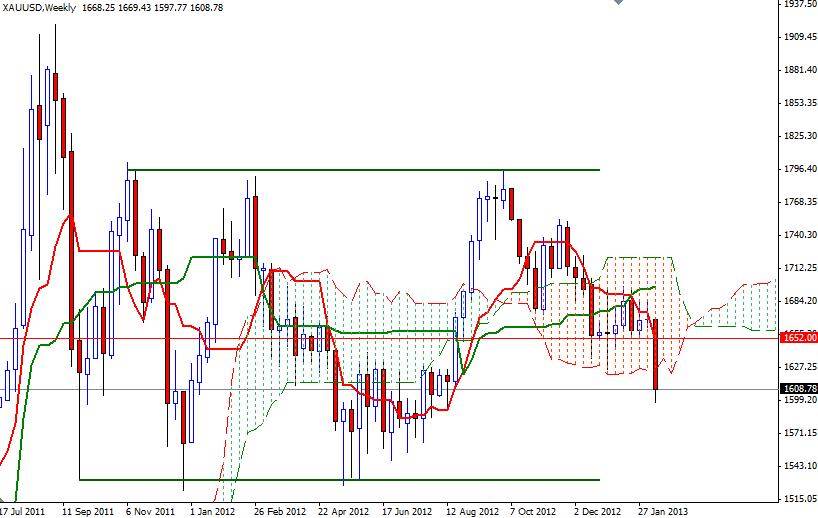
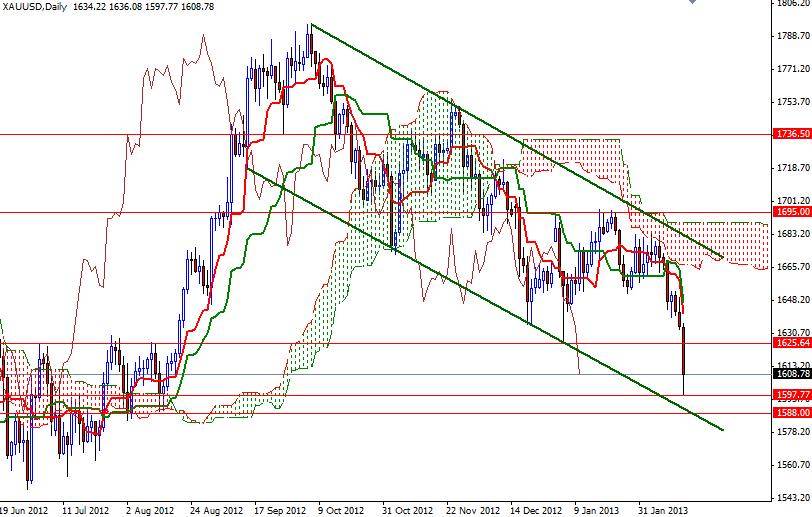
Gold settled at $1608.78 an ounce on Friday, its lowest settlement since August 17. Breaking below the January 4 low of 1625.64 triggered a sell-off which gained momentum after the latest reports released from the Unite States provided further evidence that the world's biggest economy is continuing to recover. Federal Reserve Bank of New York's regional manufacturing survey came out well beyond expectations (10 vs. -7.8 prior) and a report released by the University of Michigan showed its consumer sentiment index rose to 76.3 from 71.3. Other than strength in the greenback, media reports saying that the large institutions have been reducing their exposure to the precious metal dented investors' confidence. Gold (XAU/USD) has been in a bearish trend since October 5 when it hit a high of 1795.75. A few weeks ago the pair had tried to pass through the Ichimoku clouds (which have been acting as a resistance zone on the daily chart) but the bears showed their strength and protected this barrier. I have been telling that 1685 resistance was hard for the bulls to conquer and closing below 1660 was a clear sell signal. In the long term, this pair will remain bearish unless we broke out of this descending channel which prices have been running in since of October. Although there are some support levels below the current levels, there is a good chance we will see the pair fall further, to the bottom of the descending channel. On the weekly chart, the bottom of the Ichimoku cloud is located around the 1620 level. Therefore I think we will encounter heavy resistance between 1620 and 1625 if prices retrace before another free fall.
Also keep in mind that there is an interim resistance at the 1617.53 level. Historically, prices had difficulty with the 1620-25 zone many times during 2012 summer so the bulls will need to work hard to break through. This zone will be an important key for the continuation of the bearish run and unless prices can climb above this area, I think we will reach 1588 and 1585 eventually. 1598 and 1588 area should offer some support on Monday but if the bears can pull the pair below 1585, 1572.55 and 1563 will be the next possible targets.


