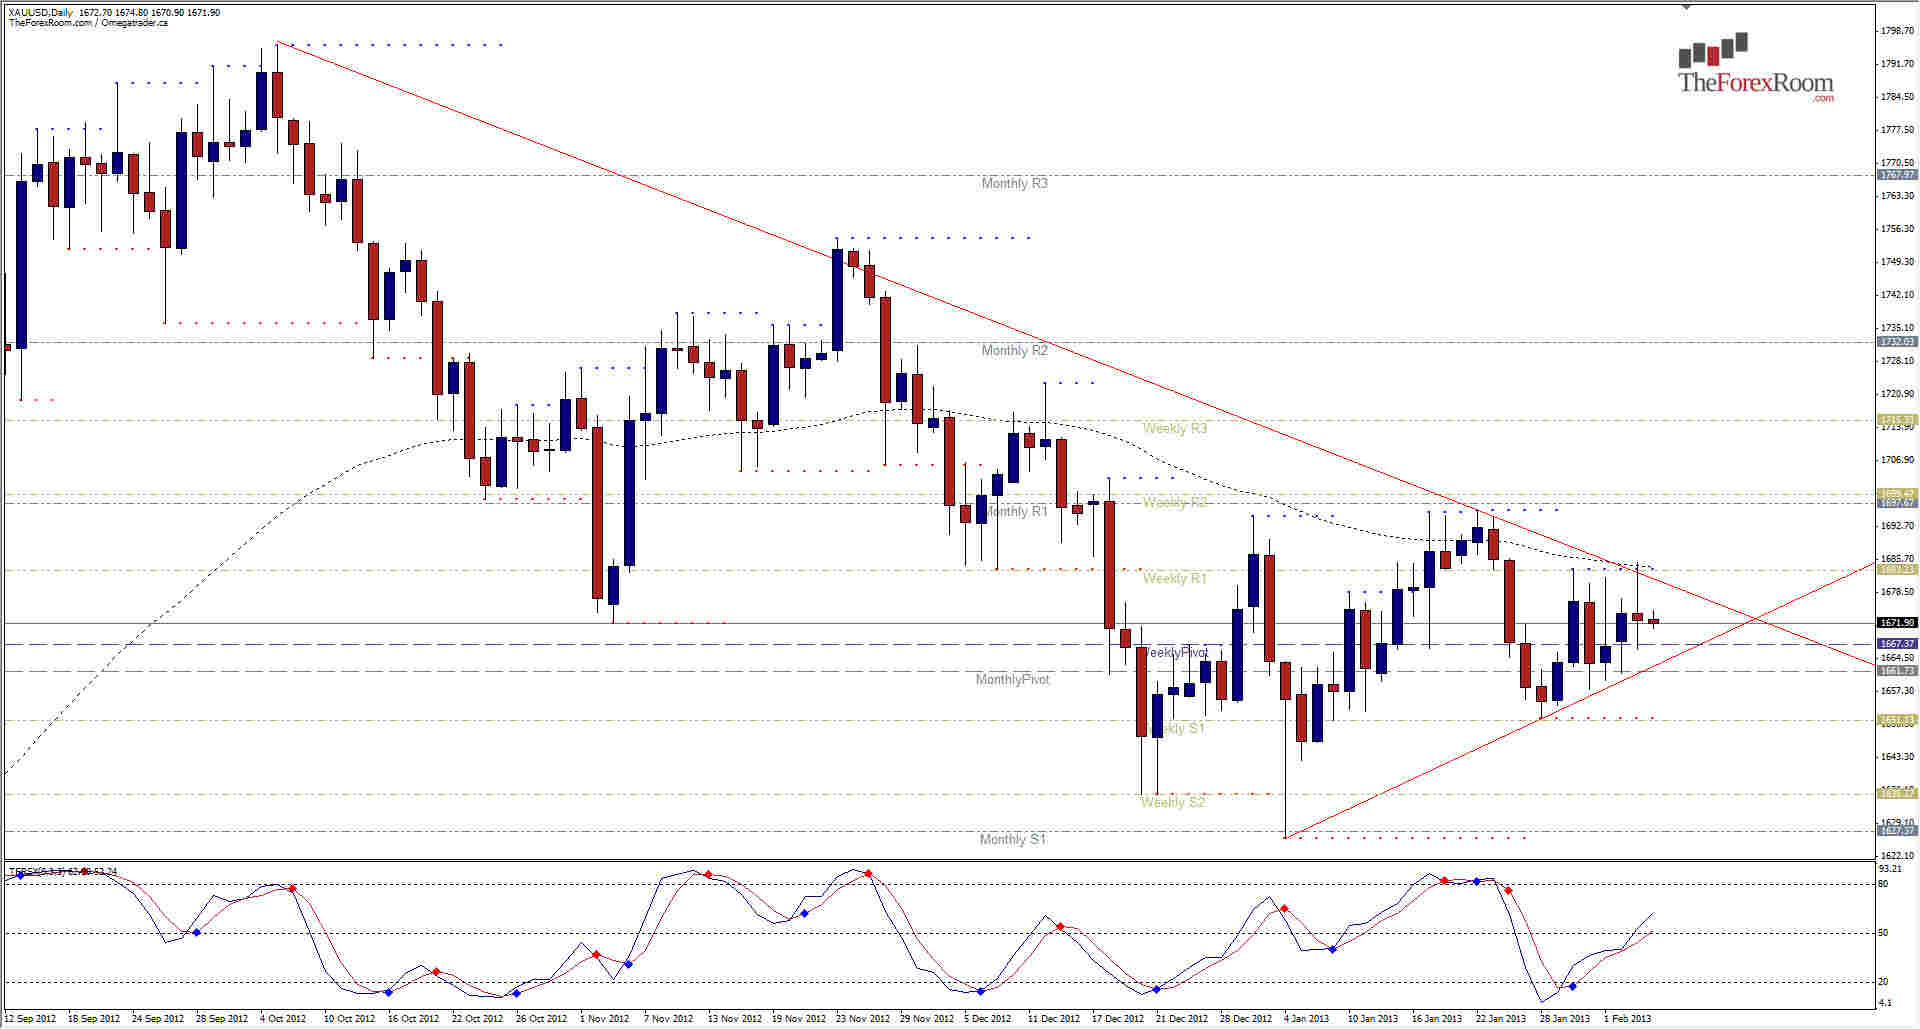
Gold has been descending into a tight triangle formation on the Daily Charts, with yesterday's price action testing the top of the channel, the 62EMA and the Weekly R1 that have all come together at 1683.50 +/-, to form solid resistance for the pair. The pseudo pin bar that formed on yesterday's chart isn't too convincing as an entry signal in this instance as the bottom of the formation is on about 40 pips below yesterday's low and is reinforced by the Weekly Pivot at 1667.37 plus the Monthly Pivot at 1661.73 (which the ascending bottom line of the triangle intersects perfectly). Clearly there is one serious action building up...kind of like the calm before the storm, or a kids wind up toy right before you unleash it on the cat. Not even the Weekly chart is much help as it is also unclear, but one interesting factor is the 62 EMA, which on the Weekly chart is at 1655.54 and acting as additional support. The last time we saw the precious metal behave this way was between July 2011 and August 2012 when the pair finally broke out of a similar but much larger formation, and quickly ran up from 1626.74 to 1795.70, the 2012 high, in only about 6 weeks. For me, the answer will come when price breaks through one of two key levels, either the upside at 1697.50 where a breakout could see the pair quickly return to 1795 or higher...or the downside at 1625.80 in which case the 2011 lows will become a possibility rather quickly. Support will come from 1591 and 1556.69, but a fall lower than 1550 could be however unlikely a run for the monthly 63EMA at 1321.50. These are of course very long term targets for the most part, but either way we will be patiently waiting to ride the resulting wave.
XAU/USD Trapped In A Triangle
By Colin Jessup
By Colin Jessup
Colin Jessup is certified in both Securities & Technical Analysis from the Canadian Securities Institute, founder of Omegatrader Canada and a Live Trading Coach at TheTradingCanuck.com, a service that calls live trades to captures dozens of pips daily with low drawdown.
Subscribe
Sign up to get the latest market updates and free signals directly to your inbox. Please enter a valid email address

About Colin Jessup
Colin Jessup is certified in both Securities & Technical Analysis from the Canadian Securities Institute, founder of Omegatrader Canada and a Live Trading Coach at TheTradingCanuck.com, a service that calls live trades to captures dozens of pips daily with low drawdown.
Read more articles by Colin Jessup- Labels
- Gold
