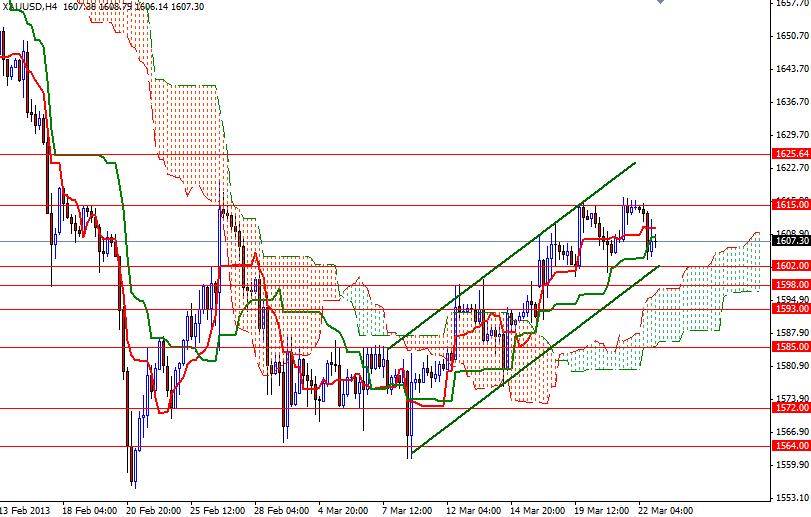
Although the XAU/USD pair settled lower on the last trading day of the week, the weekly candle was still positive. Gold prices rose %0.6 over the course of the week as the crisis in Cyprus increased desire for the relative safety of gold. However, the bulls continue to suffer as a direct result of a strengthening American dollar. The recent data out of the United States continue to indicate that the economy is on an improving track. The pair has been range bound since the bulls pushed prices above the 1602 level. XAU/USD continues to trade within an ascending channel that the market has been following since March 8 but the bulls are having hard time to break through the 1616 resistance level. Every time prices get up there, the bears come in and step up the pressure. 4-Hour chart shows that the battle between the bulls and the bears intensified in the 1602 - 1616 area. Once we get through that resistance point (1616) that will probably bring more buyers in and then we could see a test of the 1626 level which had blocked the bulls' advance on numerous occasions in 2012. Above 1626, I see a strong resistance between 1630 and 1638 area and I guess this is where the real fight is going to happen.
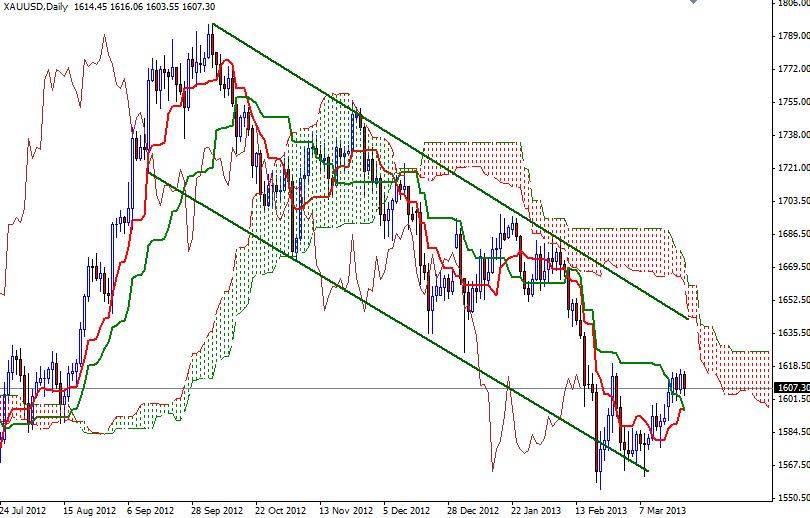
If we have a weekly close above the 1640 level, technical outlook on the daily chart will turn bullish. If prices break below the bottom line of the ascending channel (on the 4-chart) which currently sits at 1602, there will be more support at 1598, 1593 and 1585. A close below the 1585 level would suggest a real momentum shift to bearish price action.


