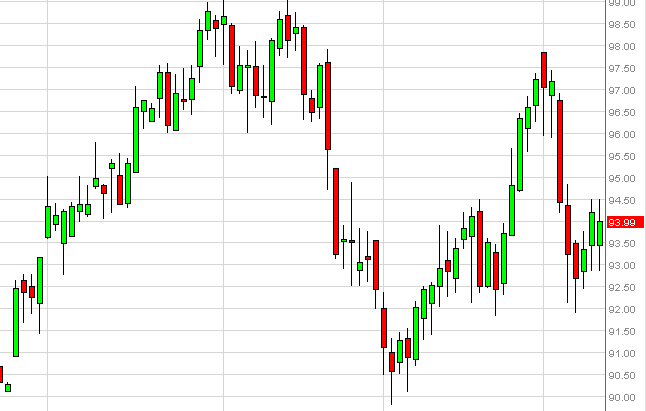
The WTI Crude Oil market had a back and forth session on Tuesday, essentially focusing on the $94.00 level. At the end of the session, we have the third the green candle in a row, and it does appear that the bullish case for a breakout above the $94.50 level is starting to gain some strength. This of course is been helped by a weaker US dollar, which looks all the world like a currency that is about to continue falling in value.
The market looks like it's trying to build some type of a base down at this area, and I believe that we will be revisiting the $96.00 level fairly soon. Ultimately, we could go as high as $98.00 without making too many waves, as the market simply looks like it's trying to find its range for the spring.
Symmetrical triangle
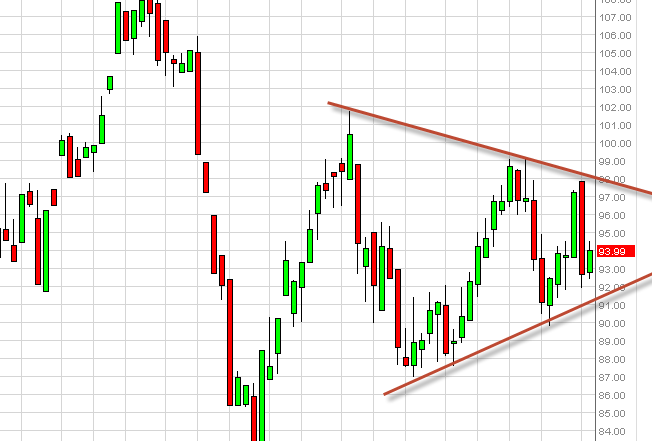
When looking at this chart however, I cannot help but notice on the weekly chart that the market looks like it wants to try and form some type of massive symmetrical triangle. Looking at this triangle, we could be doing one of two things in my mind: either getting ready to make a massive move in one direction or the other, or simply looking to drift sideways and to we find a relatively tight range over the next several months. After all, we are starting to head into the warmer months and there tends to be less action from trading desk around the world as traders become more concerned about vacations and less concerned about the markets.

Granted, if we do have several weeks before that actually happened, so I believe watching this market is going to be very important. It really doesn't matter if you trade this market or not, think of it is a "risk on, risk off" type of indicator. If we breakout to the upside, more than likely the US dollar will get pummeled and many of the higher beta currencies such as the New Zealand dollar, Canadian dollar, and the Australian dollar will all advance in their value. Of course, if this market breaks down that means that the US dollar will probably be the only currency you can own.

