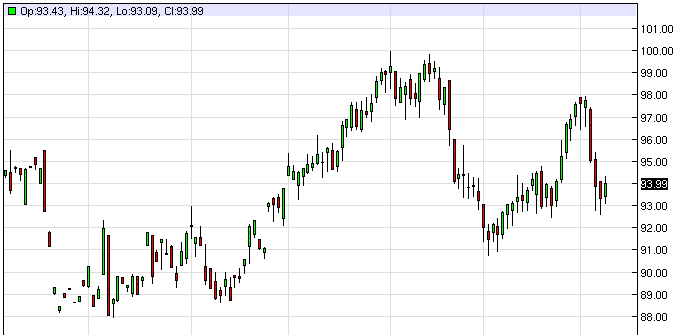
The WTI Crude oil market had a positive session on Monday, confirming that the $93.00 level was in fact going to offer support. As you look at this chart, you can see that this area has been supportive in the past, so it makes sense that it returns to be now. With that being said, the hammer from the Friday session was our first clue that we could see a bit of a bounce, and I do believe that we will eventually try to reach the $98.00 level in the near-term.
In fact, I am looking for a range in this market in order to trade it back and forth. We have just started spring in the northern hemisphere, and therefore getting closer to summer. During the warmer months of the year, the crude oil market tends to be very range bound, and I think we are trying to figure out with that range is right now.
Looking at this chart, I believe that the $90.00 level will be the "bottom" of the market at this moment in time, and the $100.00 level will be the absolute top. I do not think that these levels necessarily be tested often, and that most of the action will be between the $93.00 level, and the $98.00 level.
Massive symmetrical triangle
If you look at the longer-term charts, there is actually a massive symmetrical triangle trying to form right now. The question then becomes whether or not we break out in one direction or the other, or we simply drift through the end of it. If we were to drift through the end of it, I would be very convinced that this summer will be very quiet trading in this market, and therefore very profitable if you are patient enough to trade short term charts, and wait for the setups.
However, there's always the possibility that we breakout in one direction or the other. If that happens, it will be a very obvious trade, and we should see some real momentum enter the marketplace. However, without some type of external headline or event, I don't know that this is going to happen.

