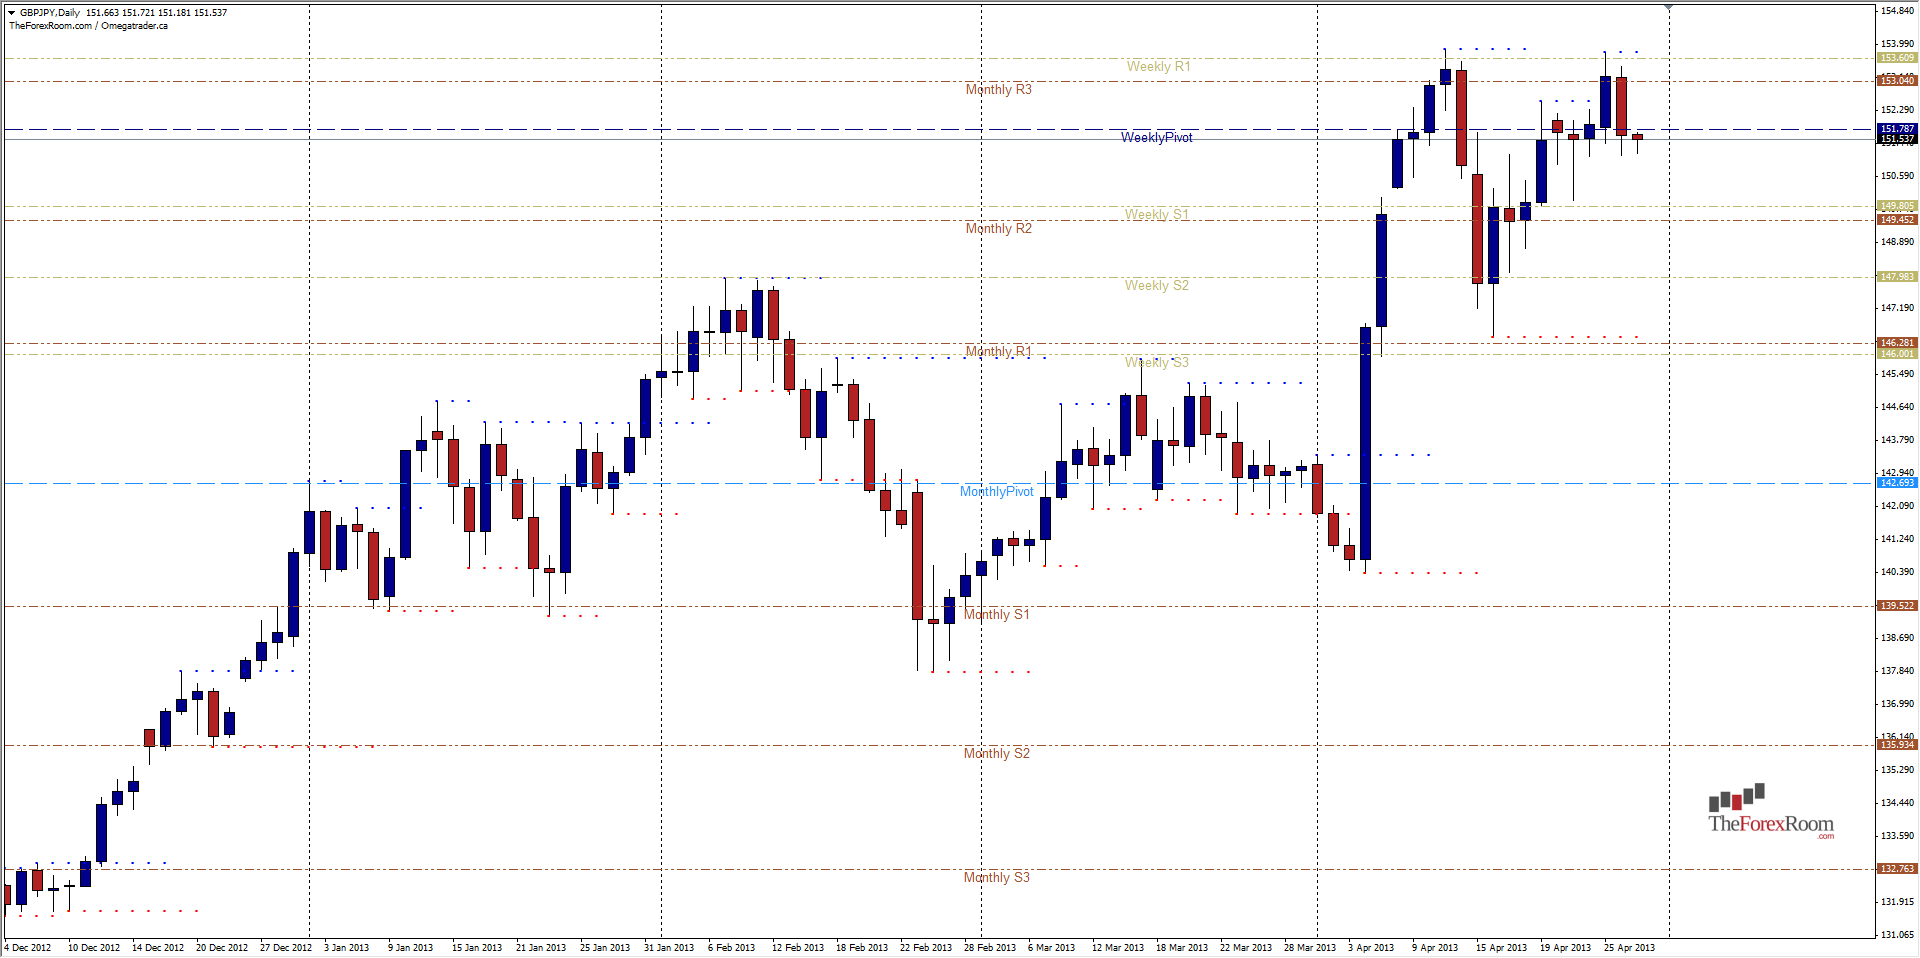
In spite of last Thursday's massive rush higher for the British Pound, the Japanese Yen is showing signs of strength against it as well as most other major currencies. The decision to refrain from further policy initiatives by the BOJ along with poorer than expected GDP numbers from the USA sent the USD/JPY plummeting, followed by other pairs such as the GBP/JPY as well. The daily chart shows us a double top, with a lower high last week than the week before and is a good sign that the bears are not finished with this pair just yet. However, if we look at the higher time frames, such as the Weekly chart we see that the last 3 weeks have been rather indecisive and have provided very mixed signals. For the week just ended, we have an indecision candle with the close being only slightly lower than the close (plus wicks on each end). Prior t that we formed a Bullish Pin Bar, although its placement would suggest it is more of a pattern known as a 'HangMan', and is actually a bearish pattern...put all of this together in the Monthly Chart however and we see nothing but bullish tendencies.
When all is said and done, it can really go both ways, and traders can profit from these swings on lower time frames for sure. Below last Friday's low, we have support at around 149.80 in the form of a Weekly S1 with the Monthly R2 slightly lower at 149.45. If this pair falls, look for this as the first target for the bears, followed by February's highs at 147.98 and the March highs further down at 146.00. To the top side we have 153.04, the Monthly R3 and Weekly R1 slightly higher at 153.60. Beyond that a break could trigger all kinds of short stop losses and long buy orders causing a rush towards 157.40 or even the 2009 highs at 163.06. Considering Japan's inflation target of 2%, I expect these highs will be taken out eventually, but we will need to watch the charts to determine when the bears are finished, and buy the dips on the way up.


