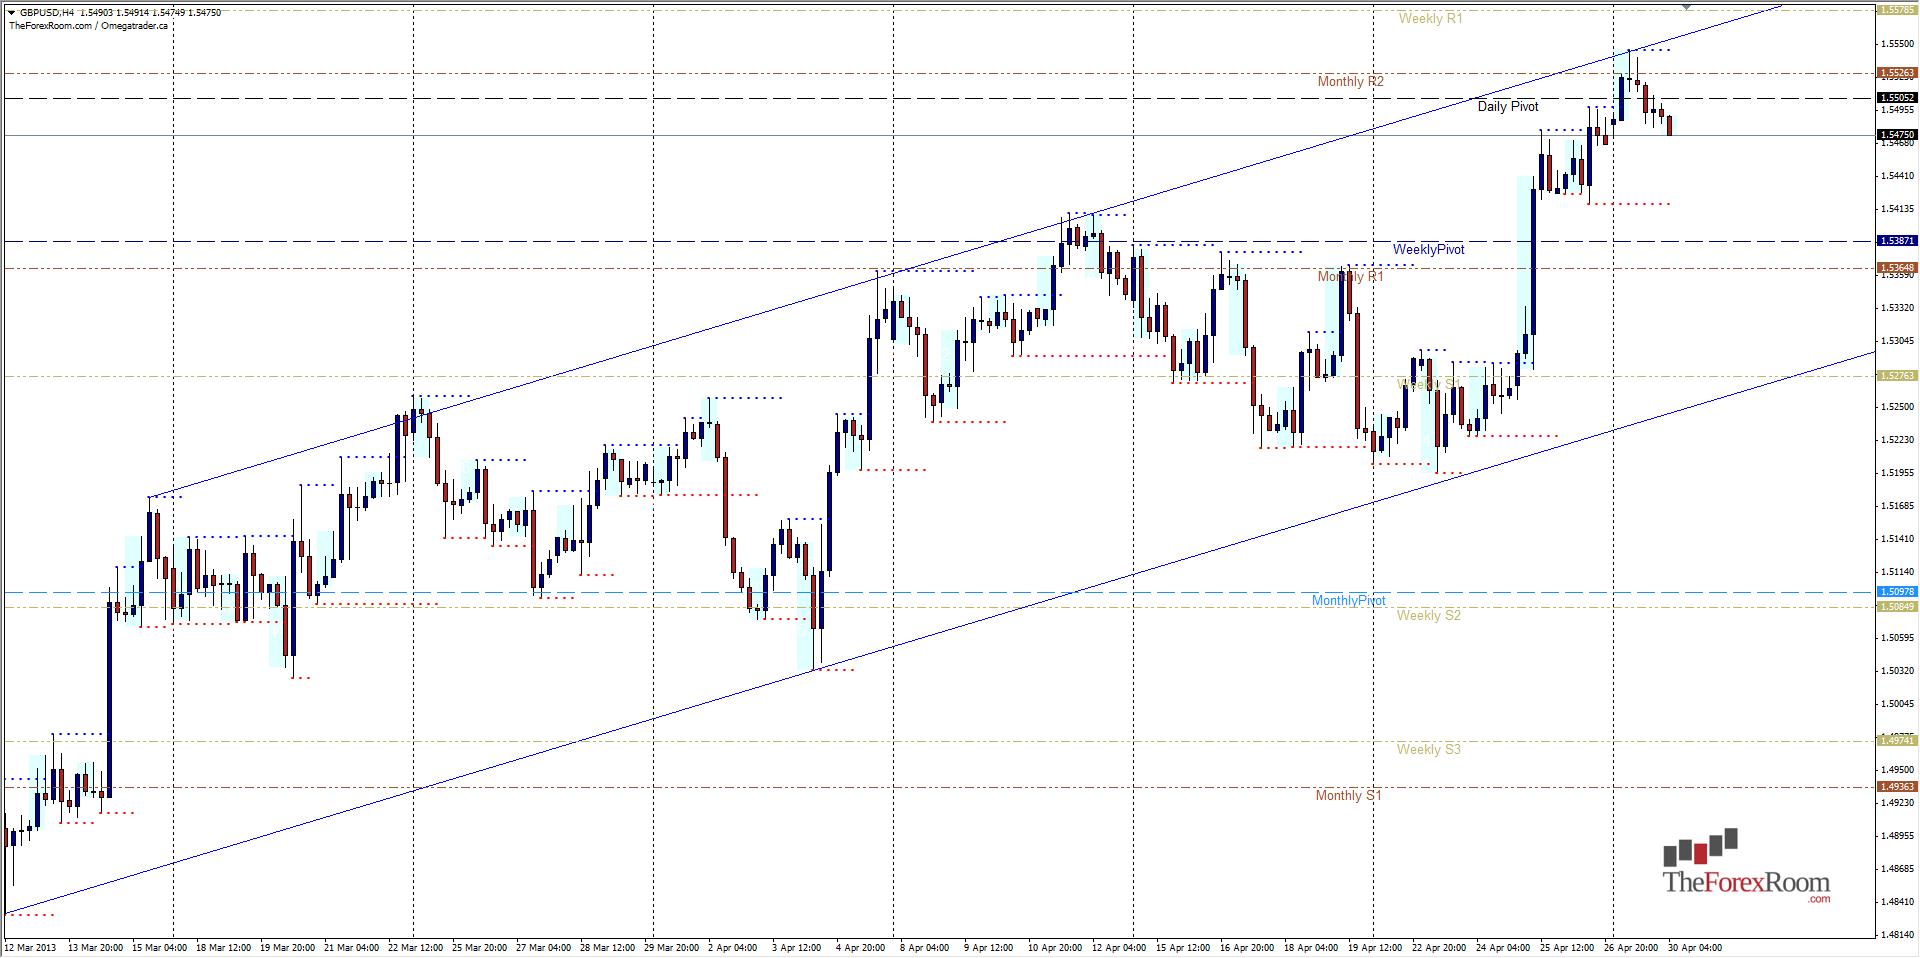
The GBP/USD traded as high as 1.5545 yesterday and closed as a daily pin bar reversal from this level as well as double Pin Bars on the 4 Hour Time Frame. If we look at a 4 hour chart, the upward channel is perfectly clear and yesterdays high marks another notch on the channel's belt, so to speak. Currently the pair is resting on support at last week's highs close to 1.5475 but appears to be staging a run by the bears in during Asian trading. If price cal close below 1.5475 on a 4 hour or higher time frame, there is tremendous downside potential with the lower band of the channel residing at roughly 1.5275, in line with the Weekly S1. There are plenty of hurdles in the way of course, such as the mid April highs/last week's lows around 1.5400. The Weekly Pivot sits at 1.5387 and there are plenty of highs lining up with the Monthly R1 at 1.5365. If yesterday's high is broken however, this will be what is called 'Fading The Tail' and will certainly bring 1.5600 into play as the next target before we possibly encounter January's lows at around 1.5675. Considering the reversal candle on the daily chart formed at the Monthly R2, this trader for one will be looking for selling opportunities down to at least 1.5400.
GBP/USD Rejects 1.5550
By Colin Jessup
By Colin Jessup
Colin Jessup is certified in both Securities & Technical Analysis from the Canadian Securities Institute, founder of Omegatrader Canada and a Live Trading Coach at TheTradingCanuck.com, a service that calls live trades to captures dozens of pips daily with low drawdown.
Subscribe
Sign up to get the latest market updates and free signals directly to your inbox. Please enter a valid email address

By Colin Jessup
Colin Jessup is certified in both Securities & Technical Analysis from the Canadian Securities Institute, founder of Omegatrader Canada and a Live Trading Coach at TheTradingCanuck.com, a service that calls live trades to captures dozens of pips daily with low drawdown. - Labels
- GBP/USD

