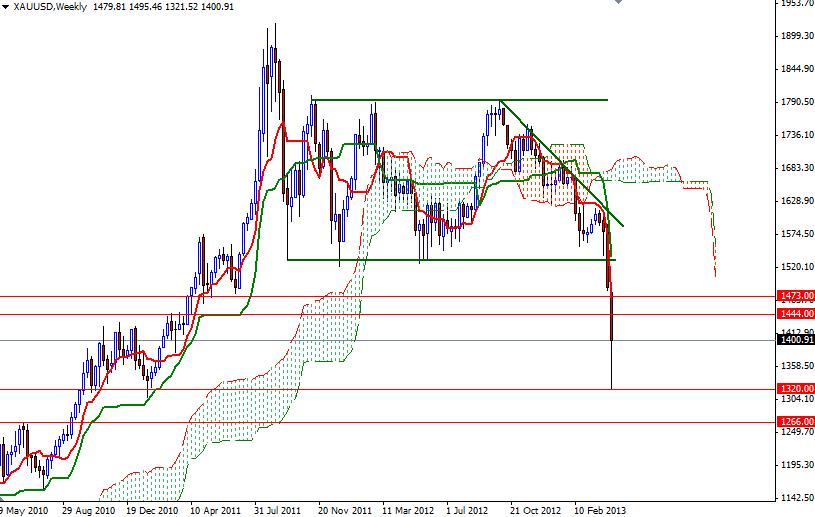
Although gold prices closed higher than opening for days in a row, we had a bearish candle on the weekly chart. The XAU/USD pair traded as low as 1321.52 on rumors that the government in Cyprus is going to sell its gold in order to supply additional funds which will be required to solve the crisis in banking sector. Although the pair found some support and lost its initial momentum, breaking out of the rectangle (which gold prices had been running in since September 2011) was a very important event for those who believe in technical analysis. Because of that I think gold prices will continue its decline in the long term (until the charts show a reversal pattern of course). If you measure the previous consolidation area (roughly between 1795 and 1530) which is broken now, you could get a very reasonable target of 1266. Maybe this sounds crazy but this is what we get when we look at the charts from a purely technical point. However, just one week ago I was telling that we are going to reach 1446.50 and 1325 eventually.
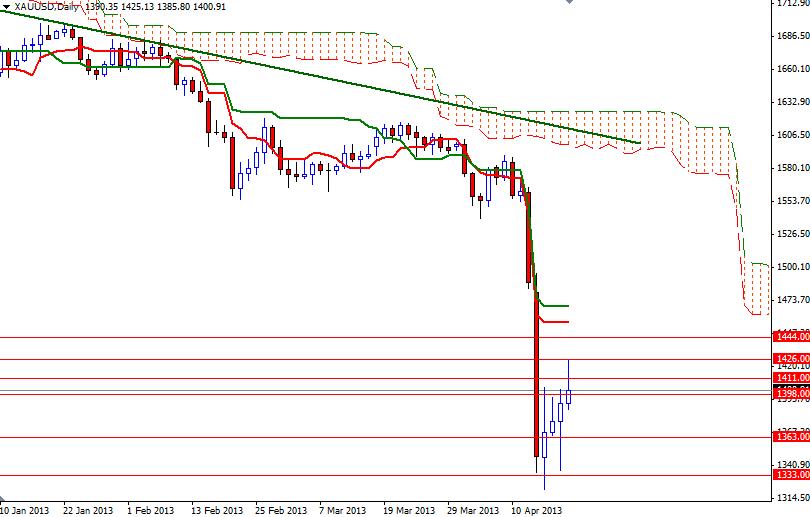
From an intra-day perspective, I will be focusing on the 1426 and 1398 levels. The fact that we have seen a shooting start followed by a hammer suggests that we are going to be range bound. The 1426 - 1444 area appears to be strong resistance and 1320 level looks supportive. As a result, I think we will see more consolidation in this zone (1320- 1444) for some time. To the upside, expect to see resistance at 1411, 1426 and 1444. If the bears take over and prices turn south, expect to see support at 1398, 1385 and 1363.


