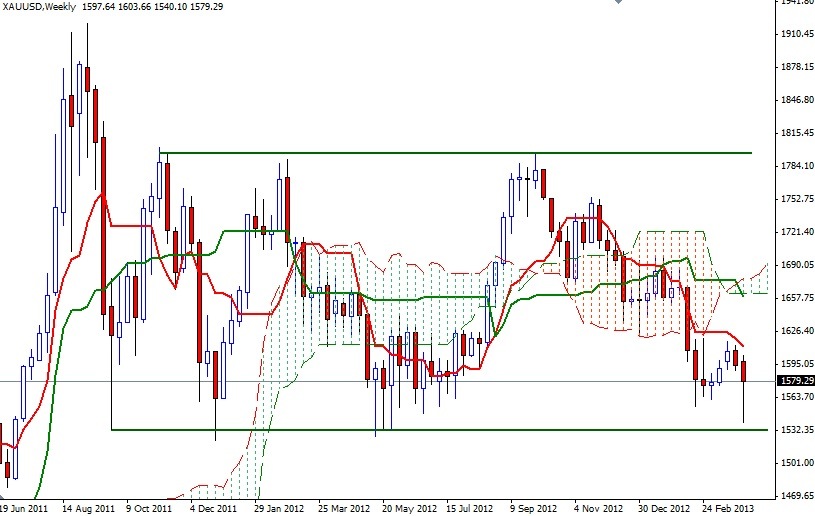
Although the XAU/USD pair (Gold vs. the Greenback) fell for the week, the pair bounced off of the 1540.10 level which was roughly the bottom of the descending channel that the market players have been following since October. We had a strong bullish candle on the last the last trading day of the week as closely watched nonfarm payroll numbers came out much weaker than anticipated. Data released by the Labor Department showed that payrolls grew by 88K in March. I think we should examine the weekly chart at the end of each trading week in order to see where we stand in the bigger picture and where we might be heading next.
From a technical standpoint, I believe there are two things to pay attention at this point. First of all, the pair has been trading in a massive flat channel for 80 weeks and we almost approached to the bottom of this consolidation zone. The next important thing to consider is that the shiny metal has been bearish since it hit 1795.75 on October 5. So will gold prices stop falling and reverse? Or will the bears finally end this cycle? I think it is too early to answer these questions. I won't be buying gold on a long term basis until the bulls break through 1626 level which happens to be the top of the Ichimoku clouds on the daily chart. However, I think it is entirely possible to see higher prices as long as the bulls hold the pair above the 1564 level.
If that is the case, expect to see resistance at 1587, 1598 and 1603.84. If the bears take over and drag prices below 1564, I will be looking for 1555, 1548 and 1540.


