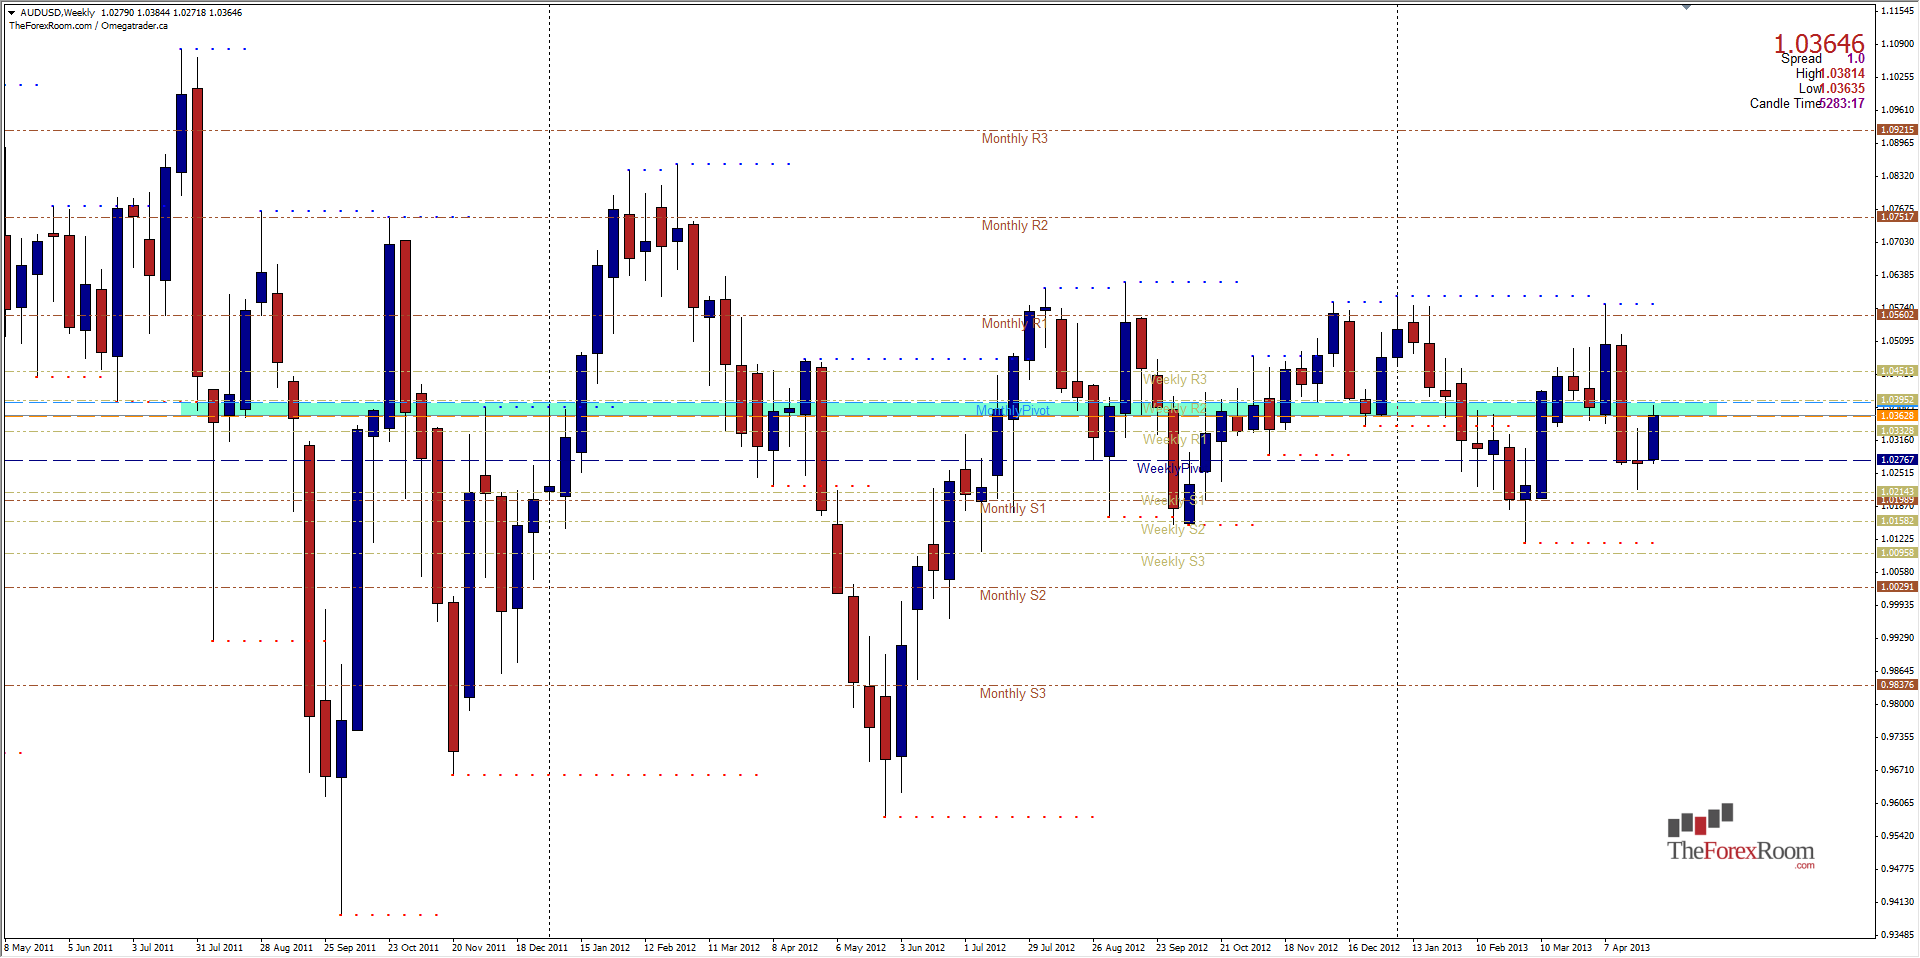
The AUD/USD is currently sitting at a level, 1.0350-1.0400 that has been a key pivotal level for the pair. Looking at a Weekly chart we can see very clearly how important this area is for the Aisa-Pacific currency. The pair often reverses or stalls at this level and the pair has been pivoting around it in a horizontal channel going back to July 2012 capped by 1.0620 and supported by 1.0150 for the most part. Last week we saw the pair once again test 1.0200 after falling from 1.0520 the week before. Although this is a rather large range, and it provides plenty of trading opportunities within the upper and lower ranges, one would not consider this a trending pair by any means under these conditions. The best we can hope for is to buy the lows and sell the highs and be extra careful in between. If the bulls cant break 1.0400 and close above, we will probably see the pair fall once more to test the Weekly R1 at 1.0332 and Weekly Pivot at 1.0276. If we do close above 1.0400 look for further resistance at March lows of 1.414 and 1.0450, the Weekly R2. Only a break above 1.0600 will provide any long term bullish potential.
AUD/USD Tests Key Pivot- May 1, 2013
By Colin Jessup
By Colin Jessup
Colin Jessup is certified in both Securities & Technical Analysis from the Canadian Securities Institute, founder of Omegatrader Canada and a Live Trading Coach at TheTradingCanuck.com, a service that calls live trades to captures dozens of pips daily with low drawdown.
Subscribe
Sign up to get the latest market updates and free signals directly to your inbox. Please enter a valid email address

By Colin Jessup
Colin Jessup is certified in both Securities & Technical Analysis from the Canadian Securities Institute, founder of Omegatrader Canada and a Live Trading Coach at TheTradingCanuck.com, a service that calls live trades to captures dozens of pips daily with low drawdown. - Labels
- AUD/USD

