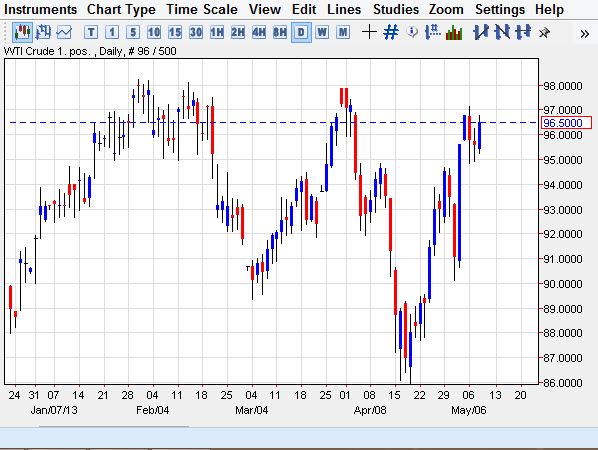
The WTI Crude market had a positive session on Wednesday again, as we continue to bounce around in a consolidation area. Looking at this chart, I can see that the $97.00 level begins a significant amount of resistance. I believe that this resistance area runs all the way up to the $98.00 level, and possibly even higher. There is a significant amount of noise from back in January in this general vicinity, so this isn't exactly unprecedented.
Looking at this chart overall, I do believe that we are getting fairly close to what I think is the top of a range. This range has $98.00 as its top, while the bottom is probably somewhere around the $90.00 level. The summer months can often see oil markets essentially grinding back and forth, and there is nothing on this chart that suggests to me that is going to be any different in 2013.
Looking at the short term charts….
Looking at the one hour chart, I can see that there is somewhat of a defined range in the short term. $97.00 certainly looks like a decent spot to see resistance, but having said that $95.00 looks even more supportive on this short-term chart. It also shows that the $95.00 level breaking down and price going below it could send this as low as $94.00 in the very short-term.
If you are a short-term trader, you may find the $96.00 level a bit too supportive to try and break down. Nonetheless, they gives is roughly $0.50 worth of wiggle room on a scout if you are so inclined. Beyond that, I expect choppy trading conditions in this will certainly be a short-term traders market by all accounts.
Of course, if we do manage to break down below the $95.00 level, we could eventually grind their way back down to $90.00 over the course of several sessions. On the upside, I see this market is essentially capped at the $98.00 level, but could eventually grind as high as $100.00, although I would think this is the least likely of scenarios.


may 9.jpg)