By: DailyForex.com
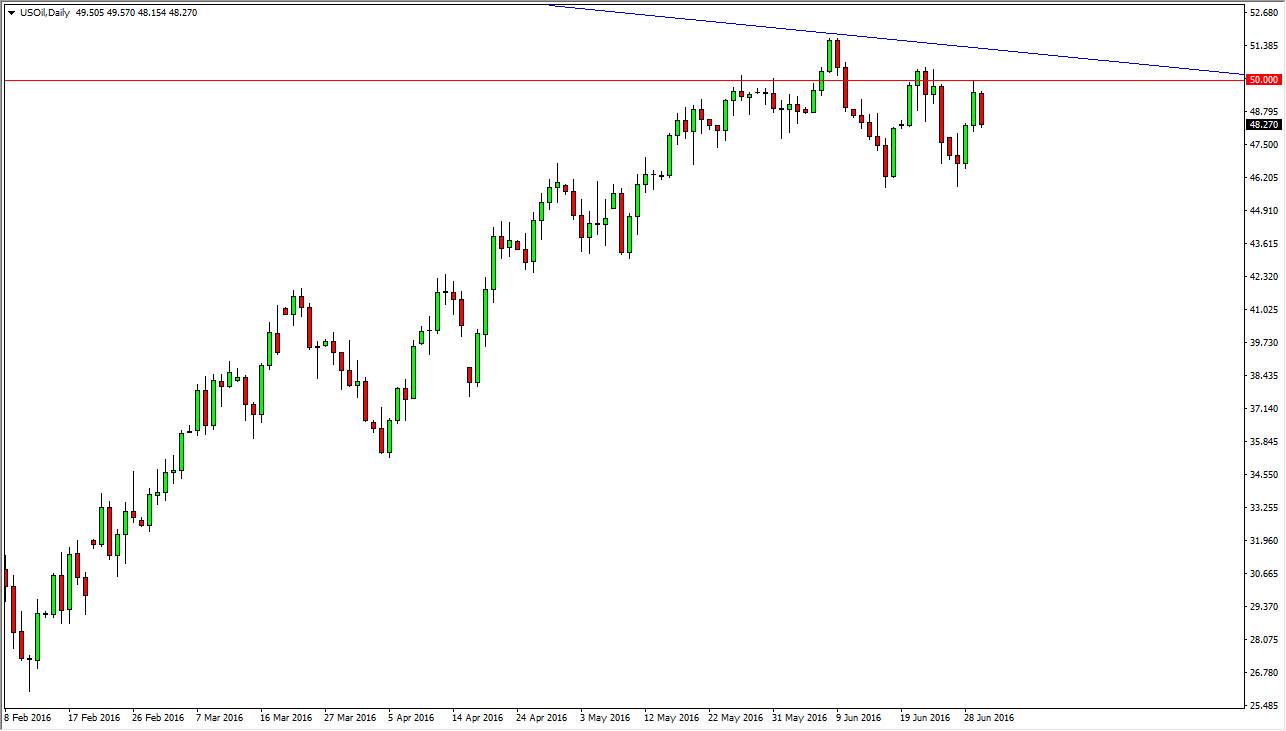
The WTI Crude Oil market continues to hang about the $96.00 level, as it had most of the week. You will see though that I have included an hourly chart from this market, in order to show the significance of the bounce that we saw happen on Friday. Because of this, it appears that the market is certainly more bullish than anticipated, but overall I still look at this market as being very choppy to say the least.
Because of this, I have been staying out of this market as it looks like trouble waiting to happen. Nonetheless, for those of you who do not treat the commodity markets this would be an excellent market to pay attention to in order to figure out how to trade the USD/CAD pair. Obviously, Canada exports quite a bit of light sweet crude oil to the United States, so as the fortunes of the oil markets go, so goes the fortunes of the Canadian dollar.
Looking at this chart, I can see that there is a significant amount of resistance at the $97.00 level, and on the longer-term charts it's actually close to the $98.00 that starts a significant barrier for the market to overcome. In fact, I see resistance all the way to the $100.00 level, and because of this I am more apt to sell this market then buying it overall. However, the short term charts look like we will more than likely have to make an attempt towards that level, which of course opens up the idea of buying this market to the shorter-term trader.
North America
The WTI Crude Oil market tends to focus more on North American prospects, and as a result this market will be stronger than the Brent market in general. Because of this, we could get a little bit of a bounce from here, but I have a hard time believing that $100.00 will be broken with any significant force, as that will more than likely spooked the markets because of energy cost in the United States. Right now, is the United States that everybody is focusing on, and therefore this chart.

