By: DailyForex.com
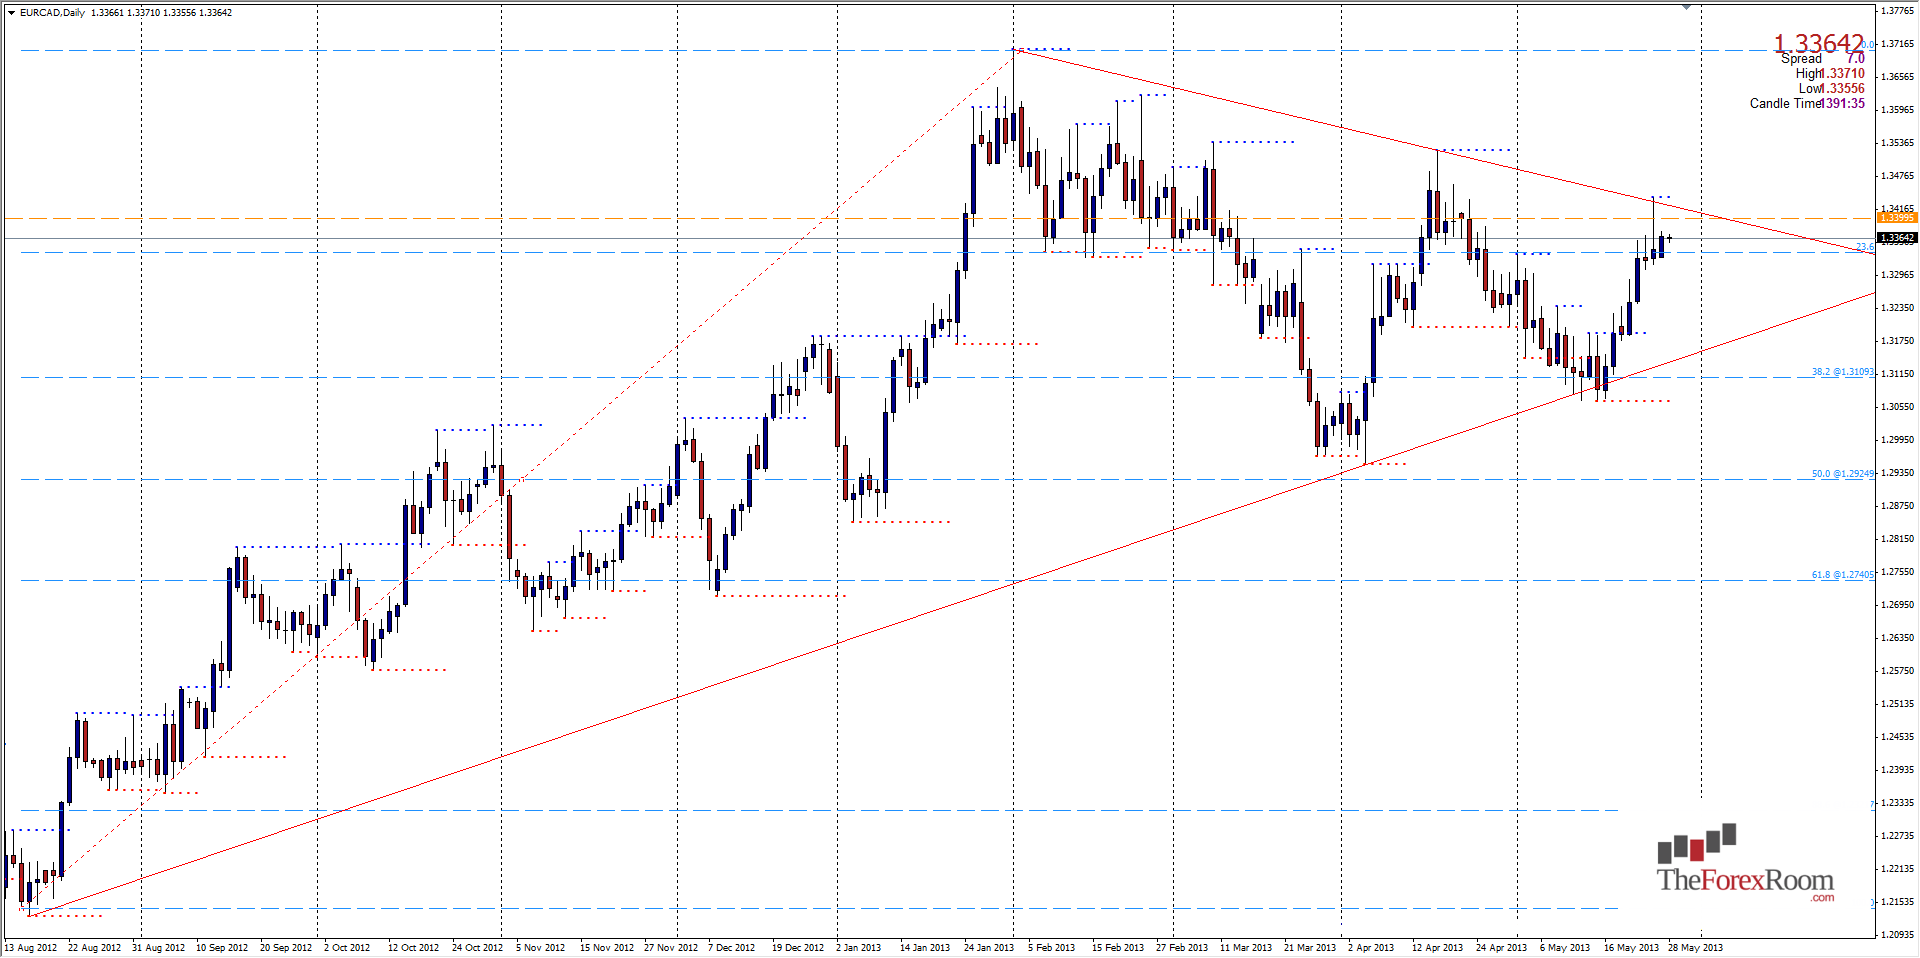
The EUR/CAD has been trading into a triangle formation on the daily chart which last Friday produced a Bearish Pin Bar Reversal candle. The high also formed the third touch in a potential descending trendline which began on February 01 of this year when the pair reached a high of 1.3708. The next point was that of April's high of 1.3523 (just 15 pips lower than March's high), both of which are now acting as resistance for this pair as is the monthly zone at 1.3395 which held the bulls at bay last week. Yesterday with low volume due to the UK and US holiday's the pair drifted higher, almost exactly 50% of last Friday's range and is now showing signs that the pair may be establishing its high, at least for the short term. The support level to watch will be that of 1.3315 (Friday's low) which if broken could see a re-test of the ascending trendline that make up the lower half of the triangle formation at or near 1.3110 and happens to be the 38.2% Fibo level for the past 9 months range which began at the all time low of 1.2129 in August 2012. Additional support can be seen at 1.3275 and December's high of 1.3185.
Happy Trading


