Start Trading Now Get Started
Table of Contents
Affiliate Disclosure
Affiliate Disclosure DailyForex.com adheres to strict guidelines to preserve editorial integrity to help you make decisions with confidence. Some of the reviews and content we feature on this site are supported by affiliate partnerships from which this website may receive money. This may impact how, where and which companies / services we review and write about. Our team of experts work to continually re-evaluate the reviews and information we provide on all the top Forex / CFD brokerages featured here. Our research focuses heavily on the broker’s custody of client deposits and the breadth of its client offering. Safety is evaluated by quality and length of the broker's track record, plus the scope of regulatory standing. Major factors in determining the quality of a broker’s offer include the cost of trading, the range of instruments available to trade, and general ease of use regarding execution and market information.

GOLD Double Bottom?

By Colin Jessup
Colin Jessup is certified in both Securities & Technical Analysis from the Canadian Securities Institute, founder of Omegatrader Canada and a Live Trading Coach at TheTradingCanuck.com, a service that calls live trades to captures dozens of pips daily with low drawdown.

By: DailyForex.com

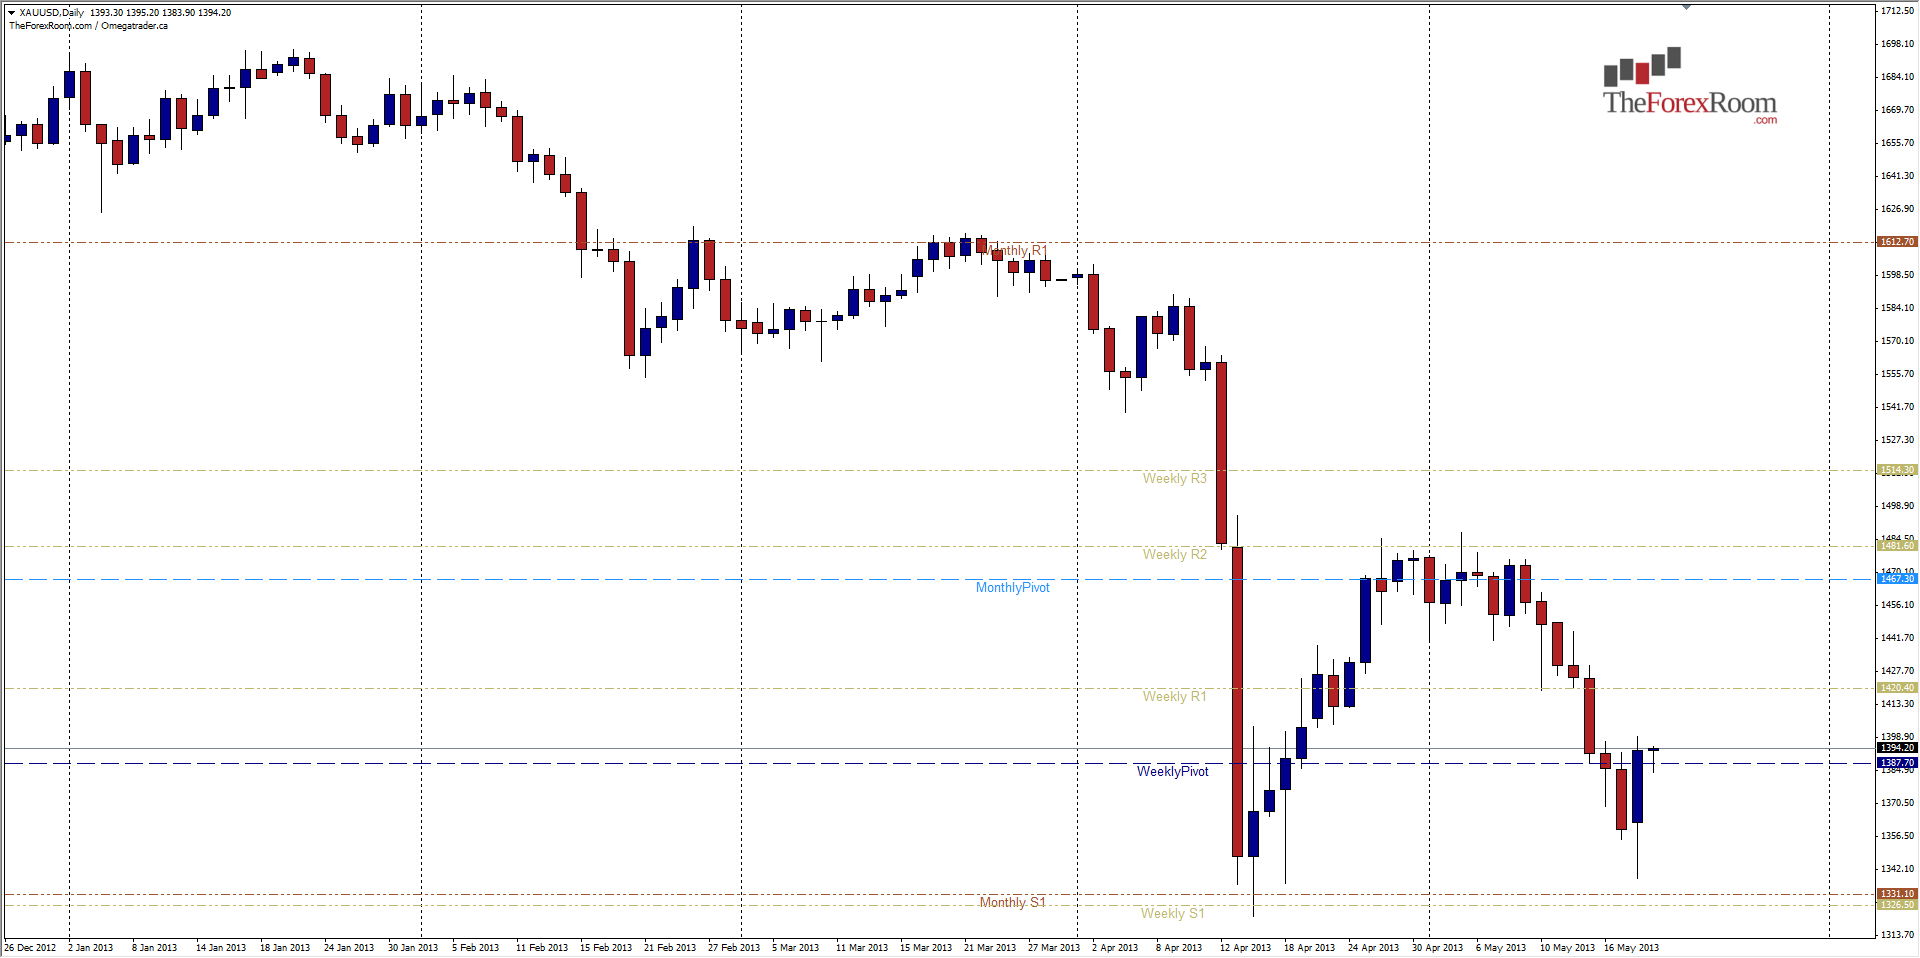
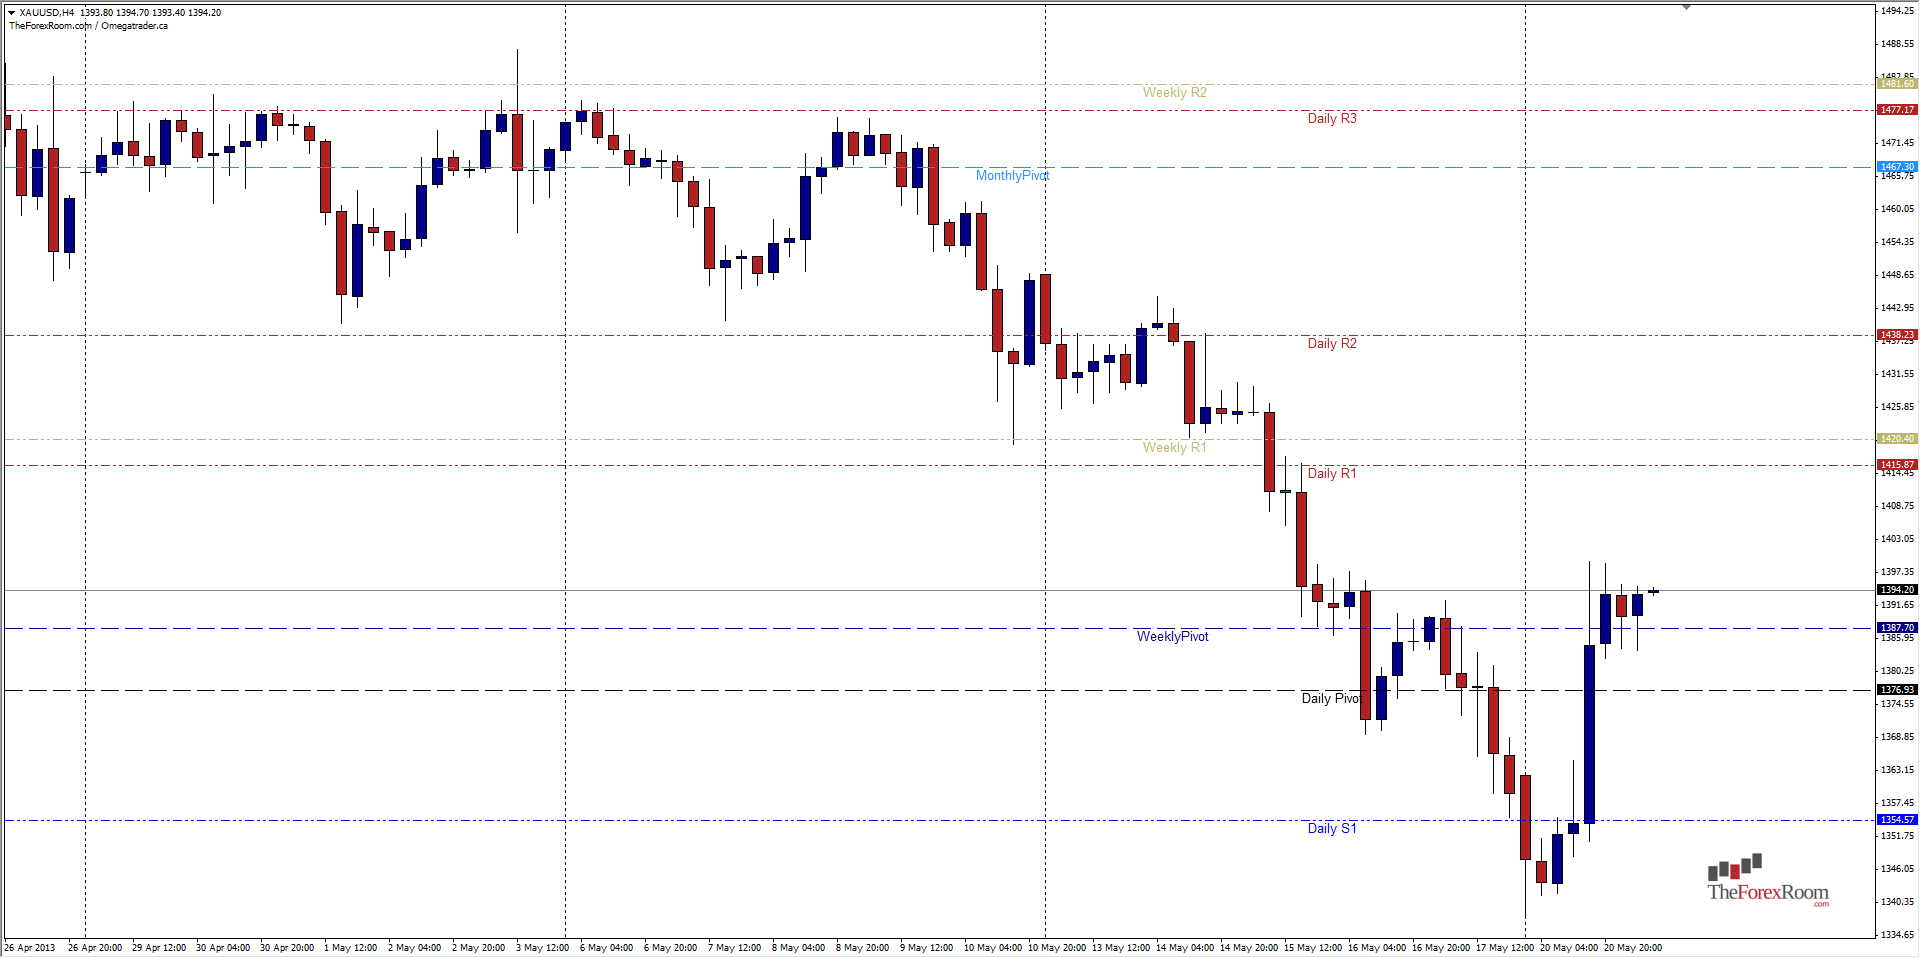
Gold(XAU/USD) has printed a double bottom on the daily chart.  This is depending of course on whether or not the new higher low holds its footing, but the 4 hour chart is also showing an interesting candle pattern.  The 4 hour chart has printed a Bullish Inside Bar setup with 3 - 4 hour candles unable to make a new high or a new low.

Gold may 21

This in itself is a rather good long signal, but when combined with the Daily Chart's Double Bottom it is even more interesting.  The 4-hour set-up has occurred with the Weekly Pivot acting as support for the Inside Bars at 1387.70 which is roughly Friday's high as well.  The double bottom itself seems to have found its support in the consolidation zone from October-December of 2010 at 1350 +/- which is also the area of the Monthly S1 Weekly S1 combined.  If the level holds, and we break the 1400 level there is a strong possibility that we could see this pair return to test resistance at 1420 and 1438 soon after.

Ultimately, if prices can once again close above 1482 (Weekly R2) aka the highs from late April through the first week of May we could see a full retracement back to the 1550 area.  However, if the US Dollar continues its run, and this pair falls back below 1320 then we could see a continued bearish run down to November 2009 and June 2010 highs in the 1230 area.

Gold may 21

Colin Jessup
Colin Jessup is certified in both Securities & Technical Analysis from the Canadian Securities Institute, founder of Omegatrader Canada and a Live Trading Coach at TheTradingCanuck.com, a service that calls live trades to captures dozens of pips daily with low drawdown.

Most Visited Forex Broker Reviews