The XAU/USD pair finally broke out of the consolidation zone that we have been watching for days as the American dollar lost ground across the board after the Q1 GDP, pending home sales and unemployment claims data missed expectations.
Data released by the Commerce Department showed that the world's largest economy grew at an annual rate of 2.4% in the first quarter, down from an initial estimate of 2.5%. Separately, the Labor Department reported that the number of Americans filing first-time claims for unemployment insurance payments increased by 10000 to 354000. And according to the National Association of Realtors' figures, the pending home sales index rose only 0.3% in April after a 1.5% gain in March.
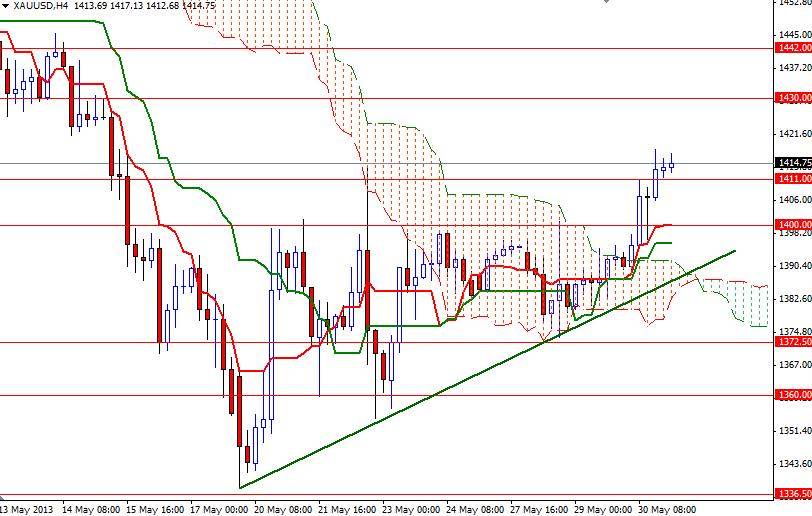
The XAU/USD pair traded as high as 1418 as soft economic data out of the U.S eased concerns that the Fed would curb its asset-buying program. As I mentioned yesterday, the key to the bullish continuation was the 1400 level which blocked prices for 10 days and we are trading above this barrier right now. On the 4-hour chart, the XAU/USD pair is moving above the Ichimoku cloud and the Tenkan-sen line (nine-period moving average, red line) crossed above the Kijun-sen line (twenty six-day moving average, green line). More importantly, after hitting the first resistance level of 1411 prices pulled back and tested 1400 as a support.
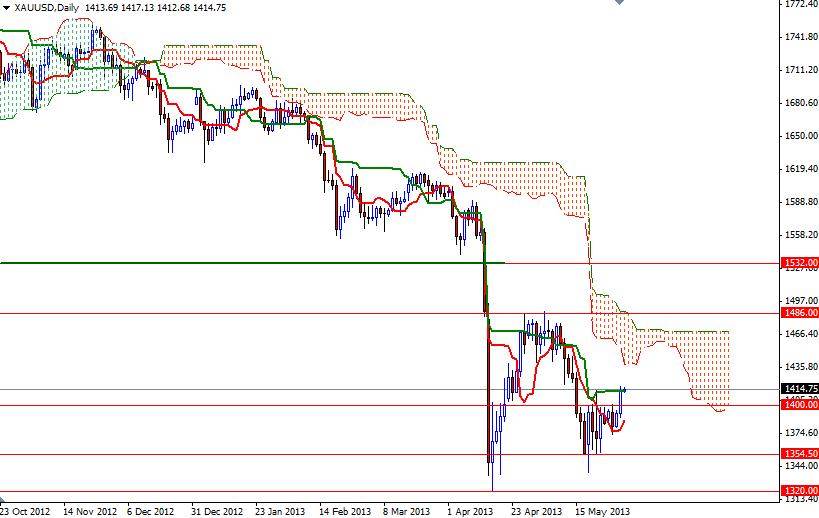
From a purely technical point of view, if the bulls manage to hold prices above 1400, it is very likely that we will see the pair testing the 1430, 1438 and 1442 resistance levels. However, I expect to see heavy resistance between 1442 and 1486 levels which defined the borders of previous consolidation. To the downside, there will be support at 1411, 1400/1398 and 1387. A break below 1387 means we are heading back to 1376.15/1372.50 area.


