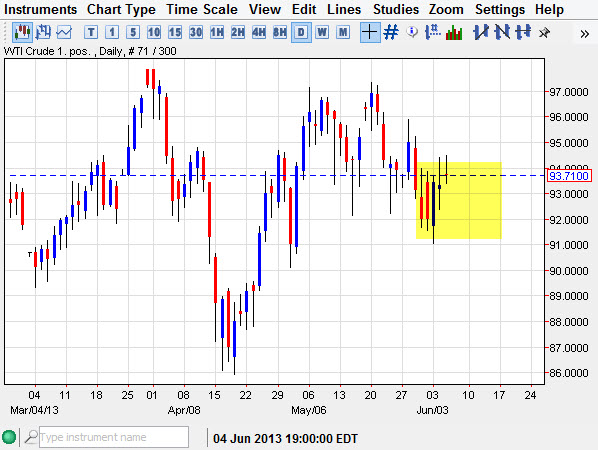
The WTI Crude Oil markets tried to rally during the session on Wednesday, but as you can see it failed yet again at the $94.50 level for the second day in a row. Because of this, it appears that the market is starting to struggle that, and it also doesn't help that we formed a shooting star for the session. On top of that, we have the nonfarm payroll number coming out on Friday which of course always causes massive volatility in the oil markets.
The main reason for this is that the employment number as a barometer of possible demand for energy as the idea of more people being hired means that more production will occur in manufacturing plants. That being the case, there's more demand for oil. On top of that, more people working means more people driving, that of course means that the demand for oil goes up there as well.
Going forward, I still think that this is a relatively choppy market just waiting to happen, and I quite frankly have no interest in being involved that at the moment. The market has been very difficult to deal with, and it's been range bound at best. With that being the case, I simply find that this market seems to be a good way to lose money these days.
It certainly has a downward bias though
I think that the $92.00 level will be tested soon, and that will eventually give way to the sellers. Eventually, we will run into the $90.00 level which of course could be very supportive based upon the fact that it is a large round psychological number, and a certain amount of clustering on the longer-term charts just below that number. In the end though, I think that the markets will only drift lower if you are lucky. More than likely, it'll be a back and forth chopfest for the remainder of the summer. Because of this, I find this a market that can only be treated on the short term charts 90% of the time, which of course means June have to be able to sit there and watch the markets. I would trade this with a downward bias if you are going to short term trade it, but only on signs of resistance on the one hour chart or so.


