By: DailyForex.com
Currency: GBP/USD
Method: Elliott Waves
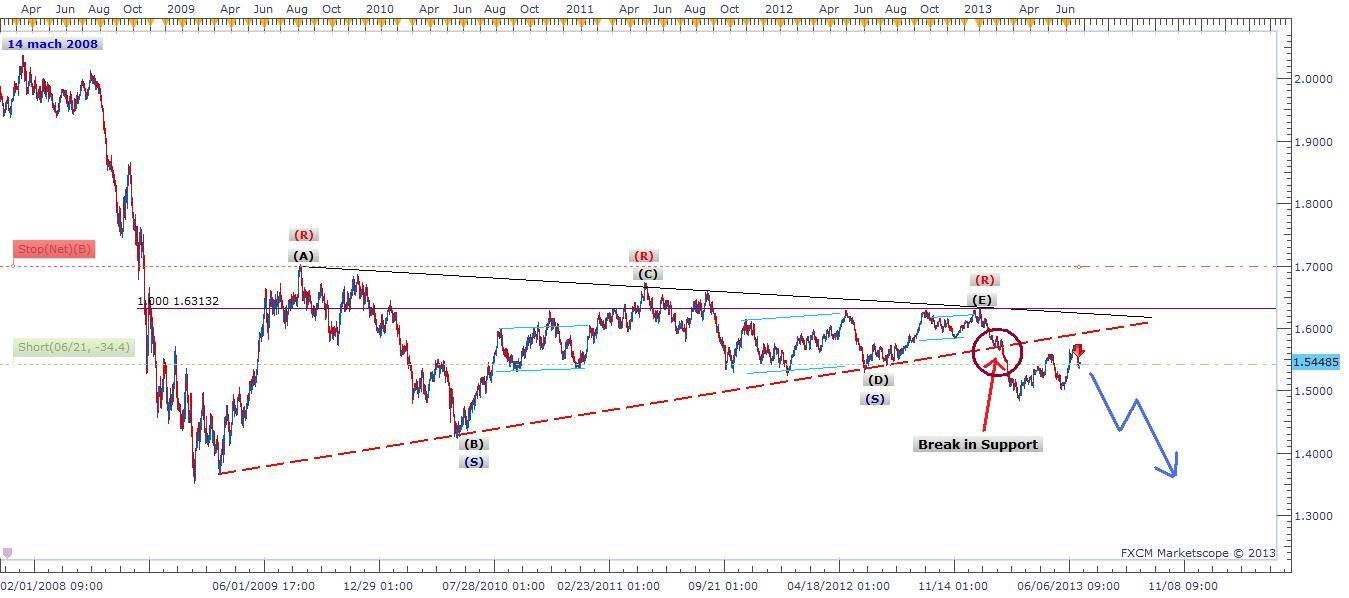
Description: Pattern trading using Fibonacci mathematics and Elliott Waves theory being very successful for years. I noticed a contracting triangle in GBP/USD being completed with five waves contracting in smaller Zigzags, Zigzags combination with three Resistance (R)'s, and Two Supports (S)'s ending with a break in support level where the third support was very weak to handle the trade as shown in Chart. This phenomena indicates a change in trend direction and continuation of the larger bearish movement that started earlier on 14 March 2008.
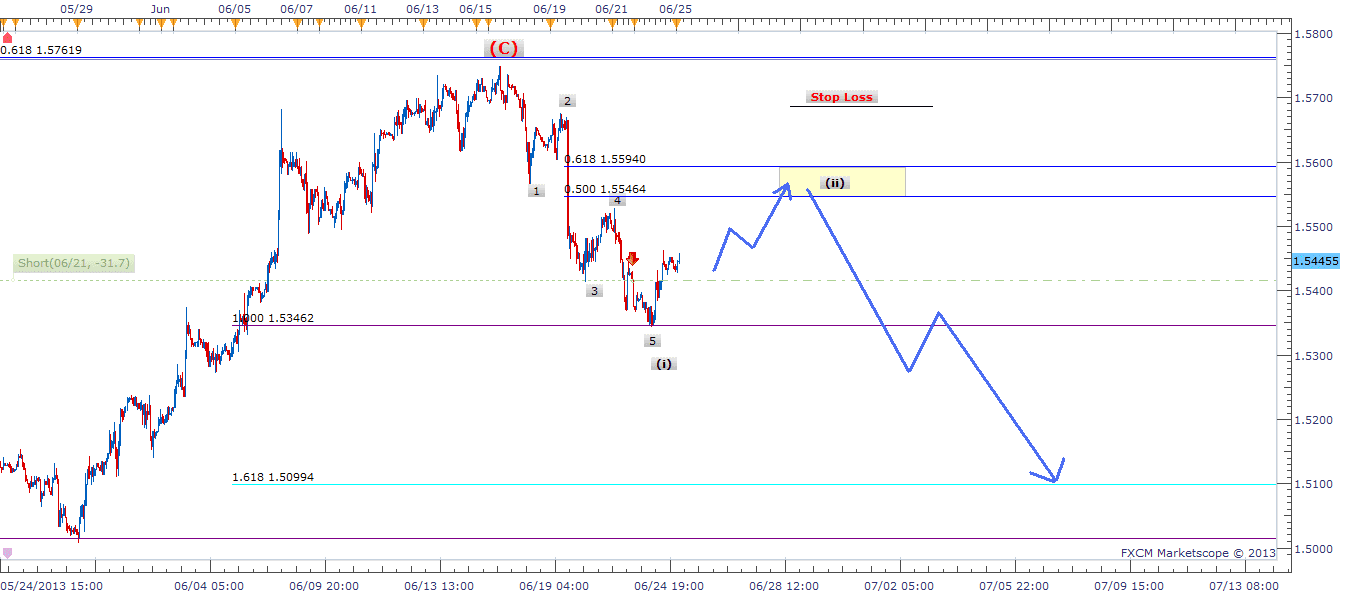
Looking at the second chart focusing on Elliott waves counts, we noticed a completed Elliott cycle just below the support line that completed a 100% movement and expected correction toward 0.618 Fibonacci level at or in between 1.55940 and 0.55464.
I have already shorted the pair because this correction will not take long, and will add more lots when trend hits Fibonacci range. The target will be open for now, the Sl will be changed later and target profit will be announced once expected wave (iii) hits its 1.618 Level. Good luck on your cable trade.
Recommendation: Sell and Hold
Trade Duration: 14 Days
Stop Loss: 1.57000
Target: Open with expectation toward 1.40000 soft target


