By:DailyForex.com
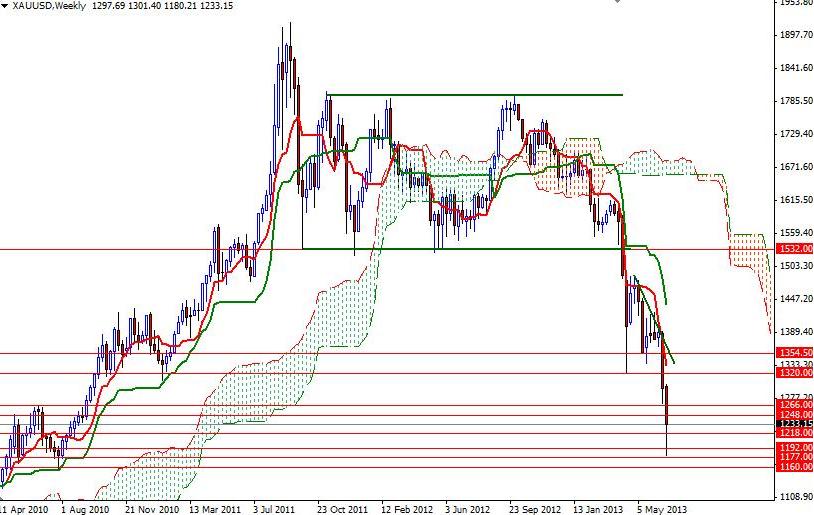
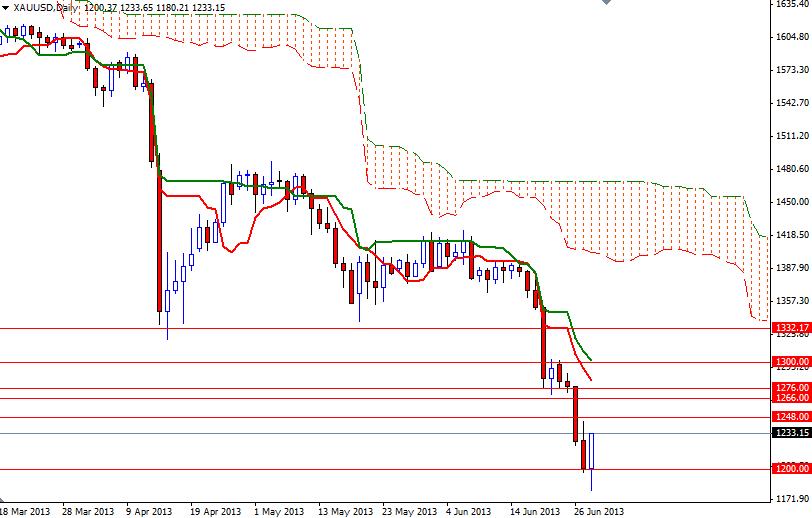
Although the XAU/USD pair fell for most of the week, it had a nice bounce during the Friday's session. The pair initially fell to a 34-month low of 1180.21 before recovering to 1233.15. Gold prices have been falling sharply since April when the American dollar got a boost from growing perception that the Federal Reserve is looking for an early start to tapering off its quantitative easing program. During this period, low inflation expectations worldwide and encouraging U.S. economic data dulled the precious metal’s safe-haven appeal. Investors continued to shift money from gold to equities and American dollar. As a result, gold prices dropped roughly 35% this year. Of course, now the question is how far it will go. Honestly, I don't think we will ever see the levels last seen 5 years ago because the average cost of gold production is much higher than those days. Because of that, I think the 1000 - 1160 zone will be attracting some serious buyers such as central banks. However, I also don't think that the shiny metal will see January prices again this year, unless the Federal Reserve increases the pace of its asset purchases. As I mentioned in my previous analysis, I expect to see some correction in the short term as long as prices continue to trade above the 1160 level. I think Friday's candle supports this theory. To the upside the first challenge will be waiting the bulls at the 1248 level. A break above this level might give the bulls extra power they need to test the 1300 level but of course they have to clear the 1266/76 zone before that. If the bears increase the downward pressure and prices start to fall, there will be support at 1218, 1200 and 1192. This week sees release of important economic reports from the United States, so be cautious if you are trading around these events.


