My last analysis of AUD/USD on Wednesday 10th July last week ended with:
“For the rest of this week, if the price continues up to around 0.9250 and shows signs of reversing there, this could be a great entry level for a short trade. However if the price breaks upwards through this level decisively, we should see it continue to at least 0.9340-50.”
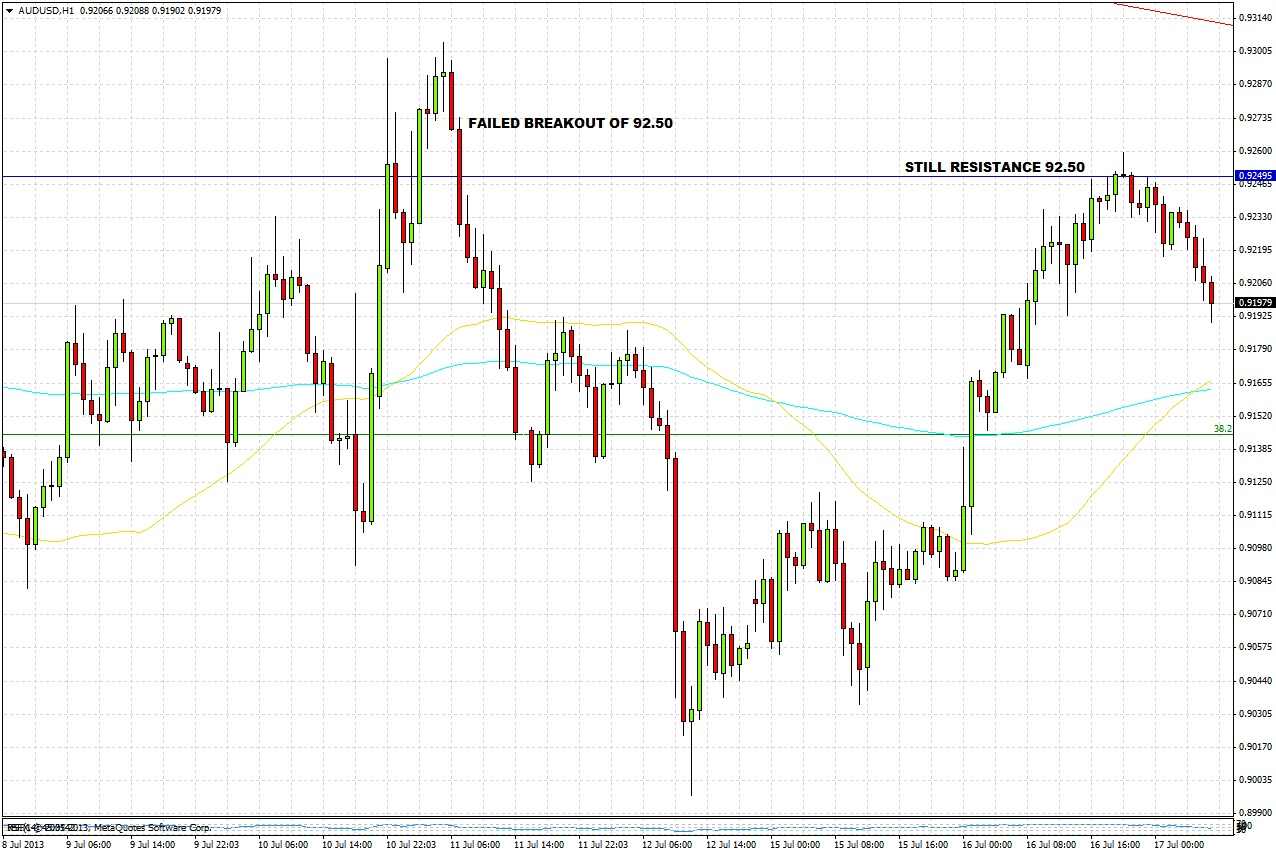
Later that same day during the second half of the New York session, the price rose very strongly by over 150 pips to test 0.9250, but was unable to close above that level on the GMT time zoned daily chart. However the first half of the Tokyo session saw the price rise again to about 0.9300, before falling dramatically until the week closed out in New York.
My prediction could be said to be 50/50 – you might have lost on a breakout of 0.9250 if you were looking for direction from the Tokyo opening, but the strong reversal at 06:00 GMT last Friday would have been a great short signal, especially if held over the weekend, which can often be a profitable action in a strong move, provided it doesn't ruin your weekend too much!
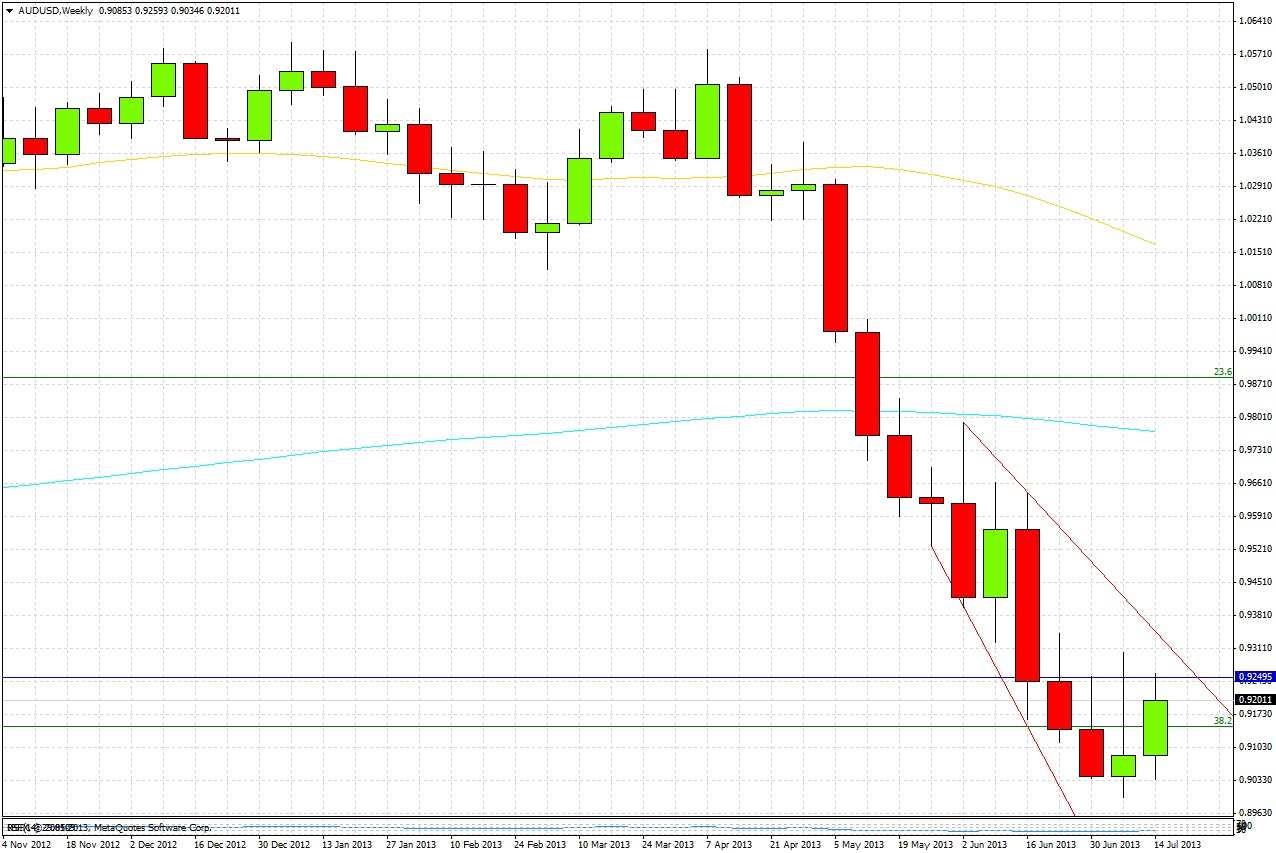
The weekly chart suggests that, as last week closed up, we are quite likely to see last week's high of 0.9304 before the low of 0.8997. However this is a weak signal, and as we have already seen the resistance at 0.9250 holding yesterday, I don't see that it means much:
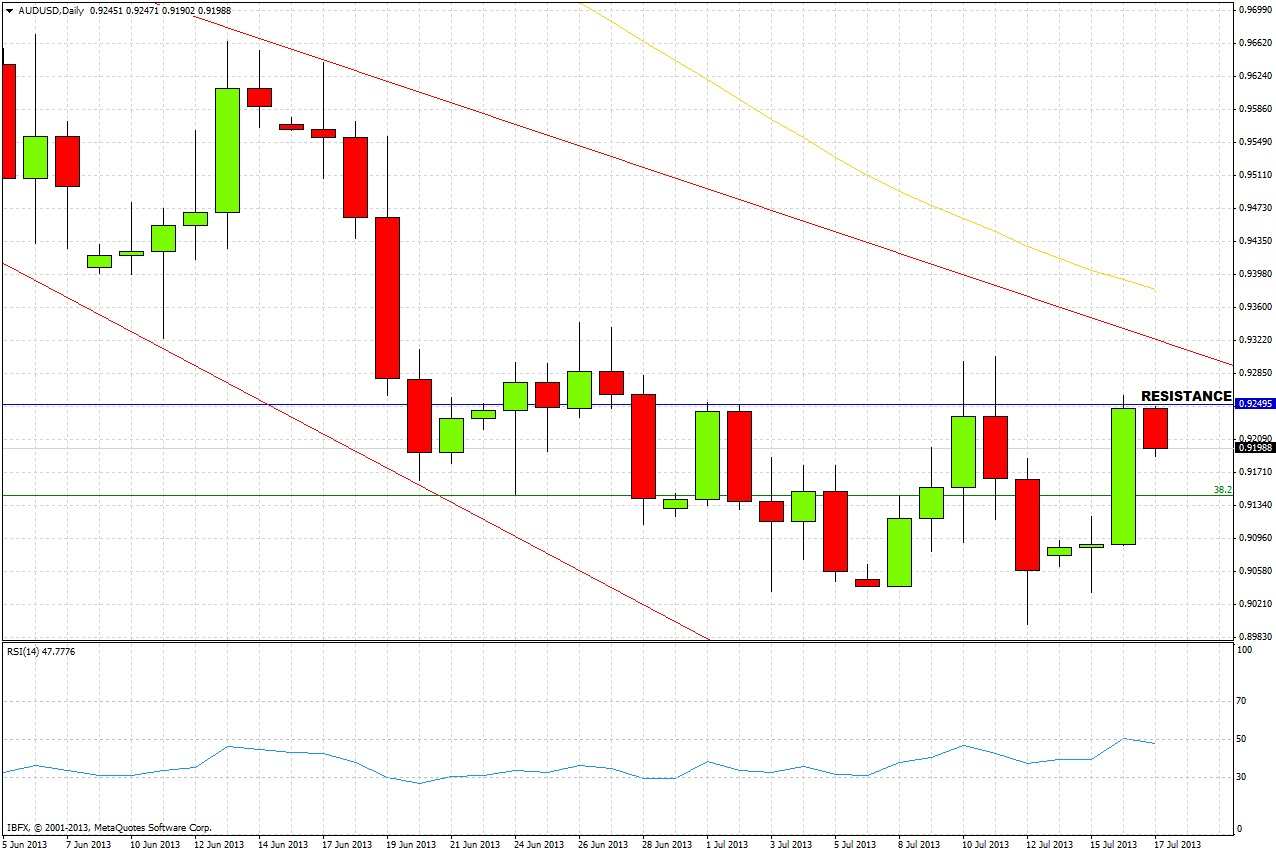
Turning to the daily chart, there is no clear price action to shed any further light:
Yesterday did see a strong bullish break of Monday's inside bar, but this bar was a doji and therefore not truly reliable as an inside bar. What we can say is:
1. The downwards price channel is still intact.
2. The upper trend line is approaching, in conjunction with the established resistance between 0.9250 and 0.9304.
3. The resistance at 0.9250 was tested yesterday, and held.
4. The down trend is intact, and the 50 period SMA is still above us and sloping down.
5. We are seeing the RSI-14 very close to breaking through the key level of 50, which would be a very bullish sign.
For now, this pair stands too uncertainly to make any concrete predictions.
If we see a close this week above both last week's high of 0.9304 and the upper trend line of the daily channel, along with a sustained break above the 50 level on the daily RSI-14, these would be strong signs that a bullish reversal is beginning, and traders should then look to initiate long-term long positions for potentially huge profit.
Until these events happen, we are still waiting for this down trend to reverse, with potential for some conservative shorts in the meantime.


