In my previous technical analysis of this pair on 1st July, I made some specific predictions. Let's see how they turned out:
1. The next move would be bullish. I saw this due to the price being within a bullish monthly reversal zone with an unbroken low of 1.2744. One of the limitations of technical analysis is that subsequent news and event-driven serious changes in sentiment can easily override established technical factors, and we saw this happen last Thursday with the ECB's statement which sent the EUR/USD decisively downwards.
2. The low at 1.2955 was likely to hold as support. This low did in fact hold, apart from being broken for an hour or so, until the ECB's statement.
3. “If the price breaks below 1.2955 it will need some momentum to penetrate the low of the bullish daily reversal of 29th May (1.2836).” The level of 1.2836 was not decisively broken until the bullish USD non-farm payroll number was announced last Friday afternoon.
So, although it seemed that the strong downwards trend in EUR/USD was ripe for at least a temporary reversal, there has been none lasting any significant length of time. The strong downwards trend continues unabated.
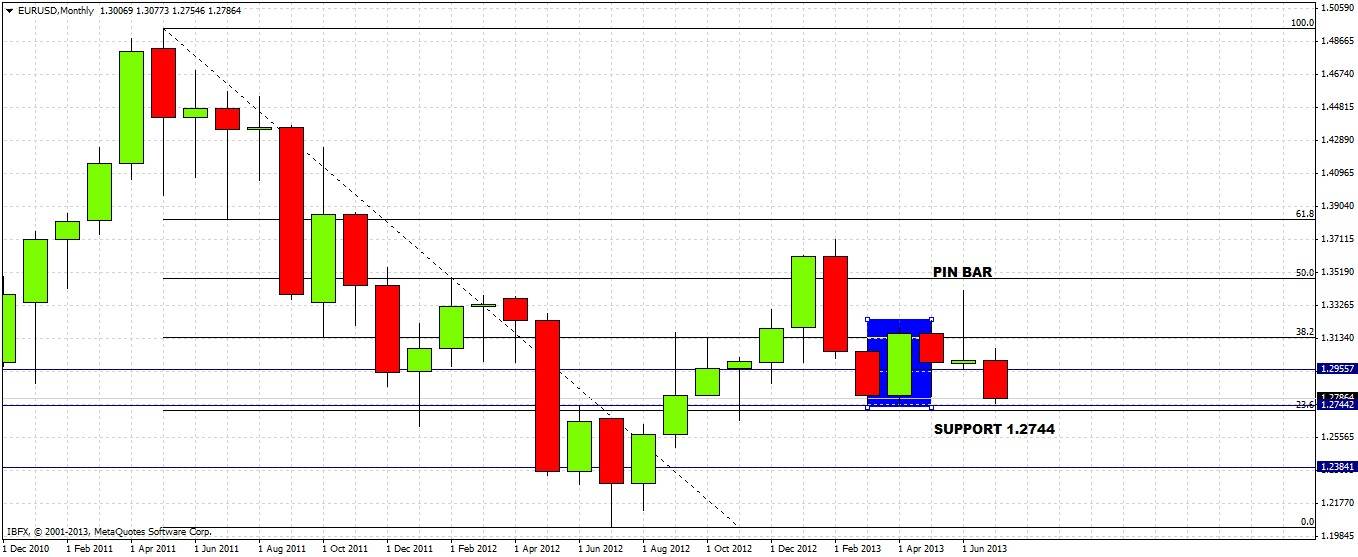
Looking at the monthly chart now, last month's low of 1.2955 was broken, and the bullish reversal's low of 1.2744 is under serious threat. Last month's action now looks like a bearish pin bar within a down trend. Overall a very bearish picture, but let's remember that this level of 1.2744-50 is psychologically and technically a meaningful zone of support.
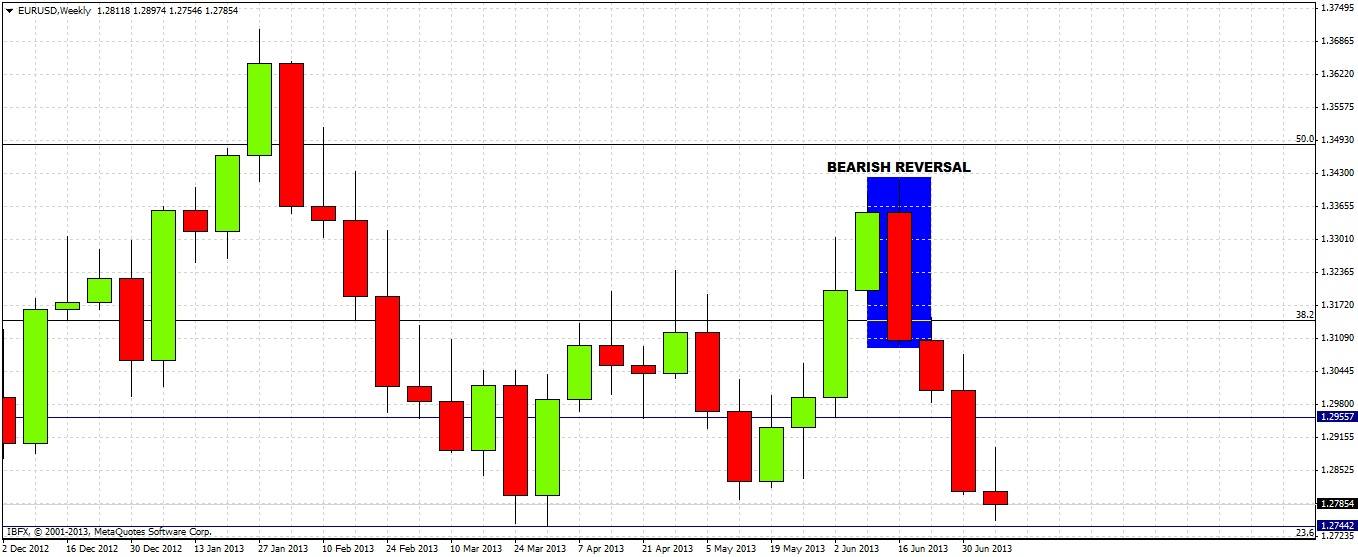
The weekly chart shows an equally strongly bearish picture, with a bearish reversal three weeks ago. Since then each week has continued down, closing hard upon each low. Should the price break 1.2744 with momentum, it should continue down to 1.2661, and if that level were broken a further move down to 1.2385.
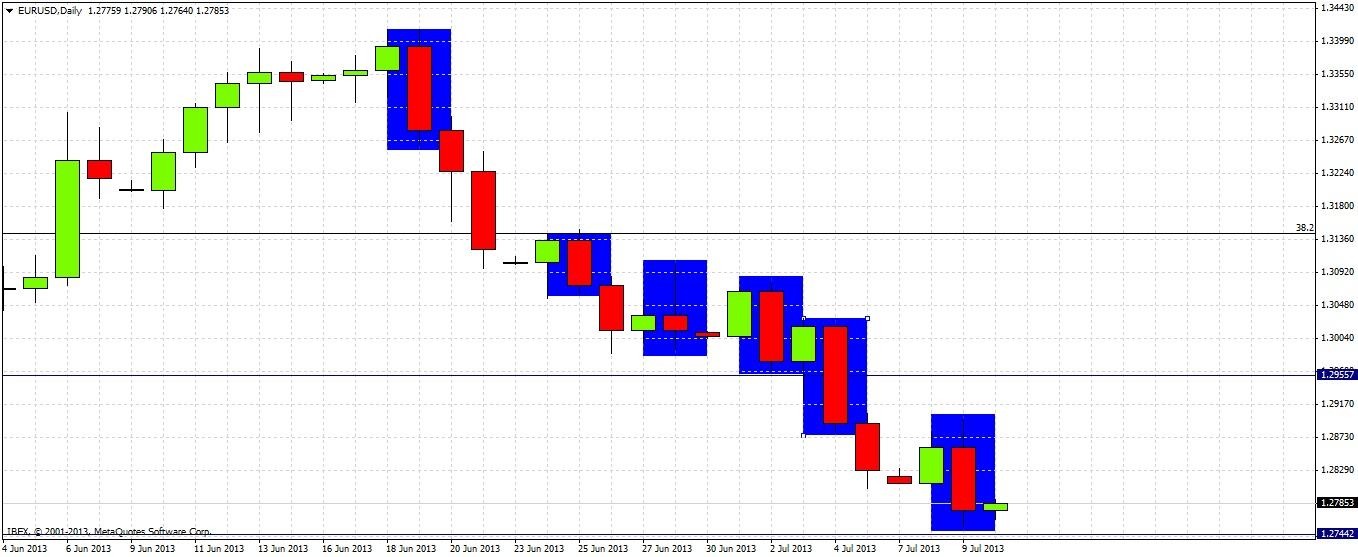
The daily chart reveals just how strong the downwards pressure is: over the last three weeks, there have been six bearish reversal/continuation daily bars. Importantly, this includes yesterday's bar:
The outlook is strongly bearish, but it may take a while for the key level of 1.2744 to be broken, although any pull-back is likely to be short-lived. If 1.2744 is decisively broken the price should continue down to 1.2661 easily. Below that there is plenty of support below 1.2624.
A breakout below 1.2744 or a pull back running out of steam at around 1.2850 would each be good candidates for shorts down to 1.2661 / 1.2625.
If the price fails to break 1.2744 by this time next week we will probably see the establishment of some kind of bullish pull back. However a break of 1.2744 seems very likely to happen soon given the very strong downwards pressure overall.


