Forecasting an entire month in advance can be tricky, as it is really too short a period to apply fundamental analysis, but long enough for plenty of unforeseen events to happen that can blow any technical prediction off course.
Nevertheless, we can start by laying a myth to rest: while August historically has EUR/USD volatility somewhat lower than average, it is usually perfectly tradable, so the idea of the summer doldrums is a bit of a myth.
Looking at historical data, we can also see that there is a pronounced seasonality in EUR/USD during the month of August: traditionally it weakens.
But does this short seasonal bias fit with the current picture technically?
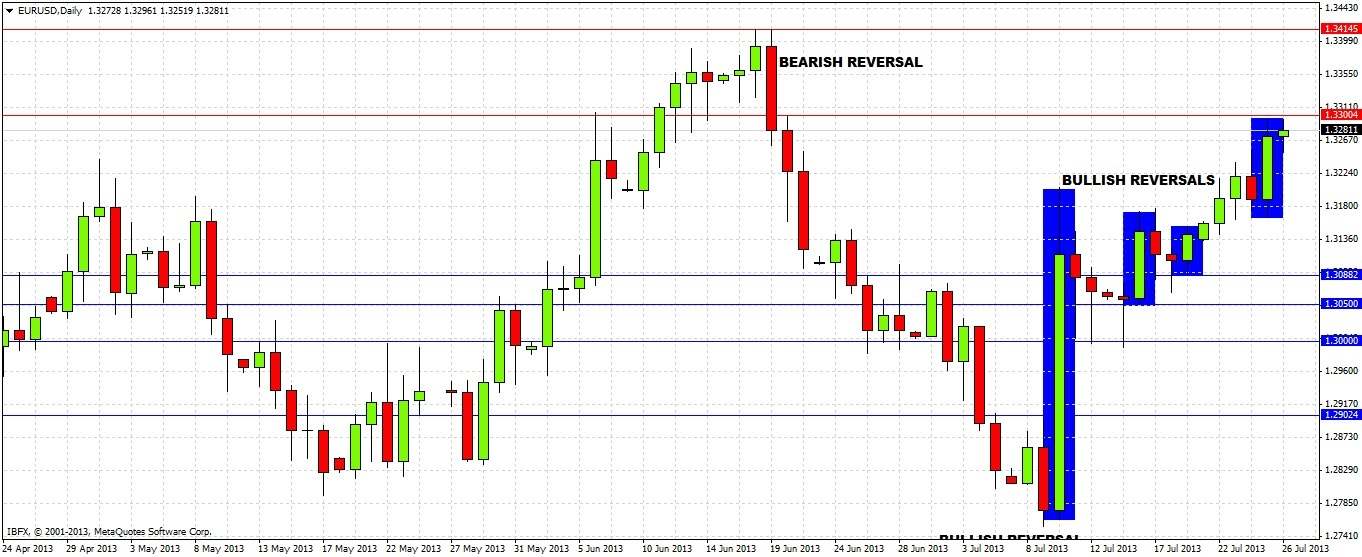
Momentum is currently seriously bullish. The daily chart shows a series of bullish reversals/continuations since early July, with resistance overhead at 1.33 and 1.3415:

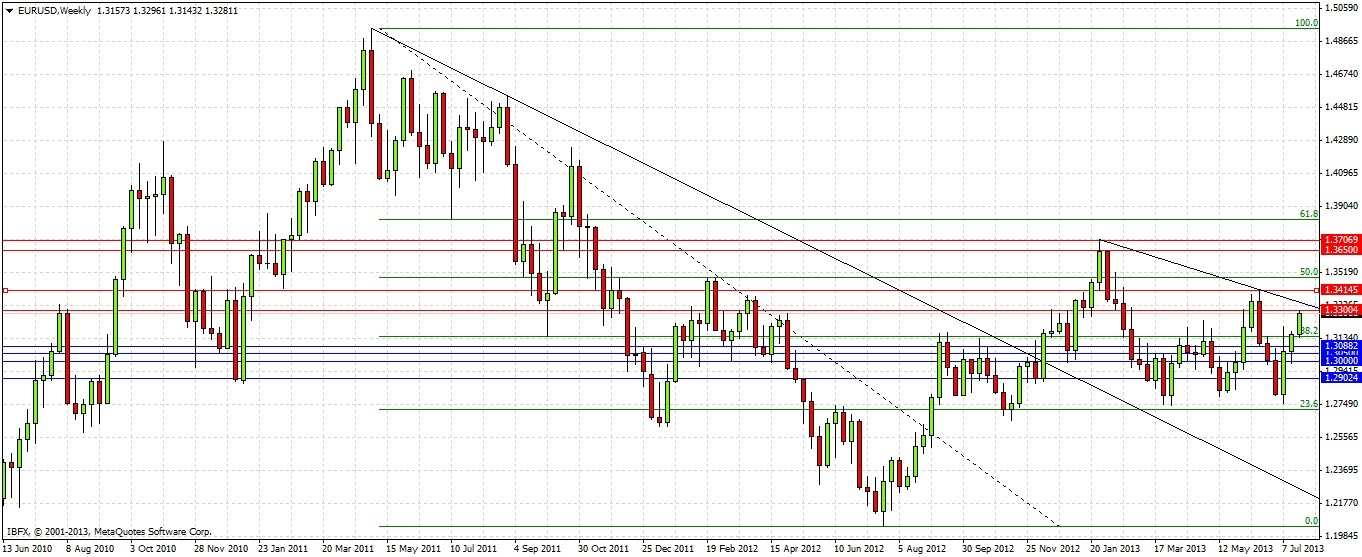
The weekly and monthly charts reflect this bullish picture, with the most recent reversals in both time frames being bullish.
As we are close to 1.33 right now and bullish, we need to look at what happened when price was last above 1.3415. Here are a few things to bear in mind:
1. Price has not been above 1.3710 since November 2011.
2. In fact, since this time, whenever price has been above 1.34 it has fallen back below very quickly, within about a week.
3. This pair still trends but within a narrower total range since the summer of 2011 compared to before then.
A look at the weekly chart over the past few years also shows that while the upper trend line of the original downtrend was broken to the upside early this year, a new bearish upper trend line was soon established. We also have a 50% fibonacci retracement level from the original long-term downtrend confluent with a round number at 1.35 that previously acted as strong resistance:
So it seems logical to expect that the current bullish trend is going to run out of momentum and turn short during August, as the line of least resistance will become downwards. It is impossible to tell whether the price will turn here at 1.33, or 1.3415, or 1.35 or even higher, but I believe it is going to have a hard time getting above 1.35.
The key variable is what happens over the next week or so. The quicker we go up and run out of steam, the more we will come down by the end of the month. However, if we go down too quickly, the support levels below us will be fresh enough to give us a bounce back up. The best scenario will be a rise above 1.34 and a period of consolidation: shorting from there should be a good medium-term trade and will likely prove an irresistible trade to the market as a whole.
We do seem to have very strong support in the 1.2750 – 1.28 zone.
Of course, any major crisis involving the EU or USA (EU being the more likely) can push the price anywhere.

