By:DailyForex.com
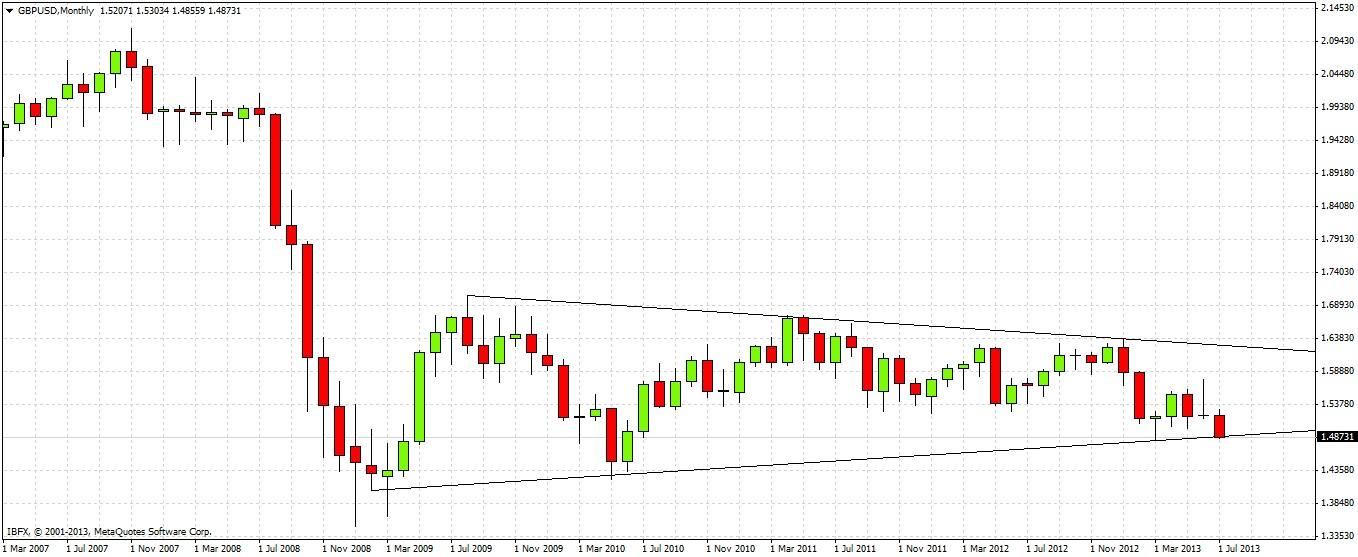
The monthly chart shows that since this pair's sharp fall during 2007-08, it has been consolidating within a pennant formation, as shown by the trend lines drawn at lower highs and higher lows in the diagram below. Pennants tend to indicate continuation, suggesting that over the very long-term, GBP/USD will continue to fall.
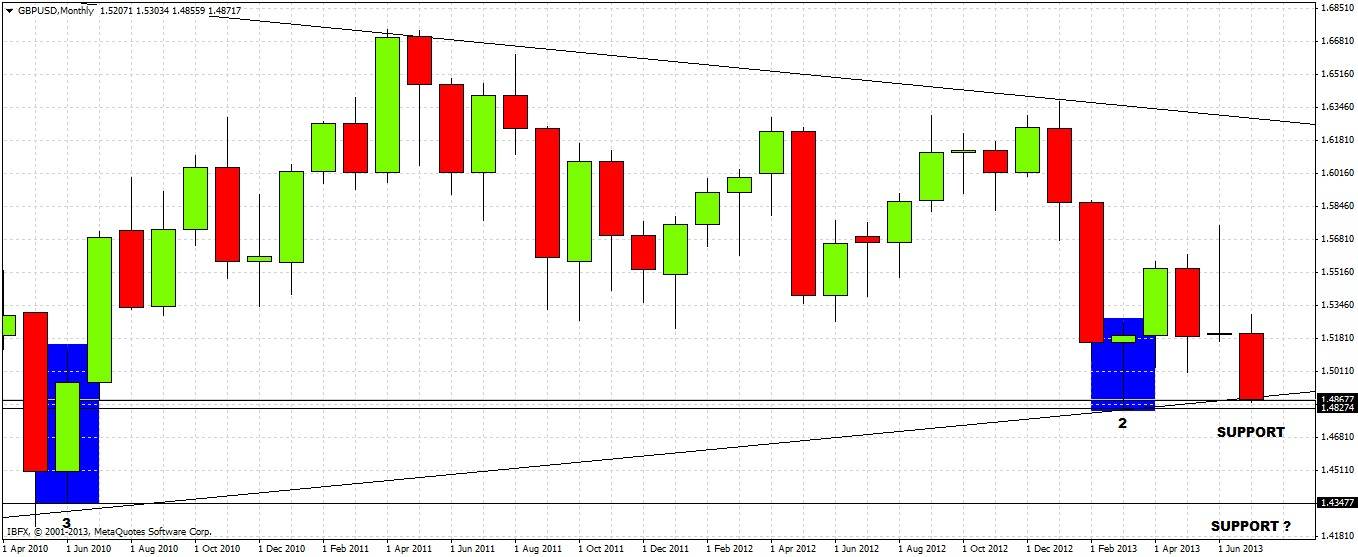
The bearish reversal in January is more immediately interesting, as this triggered a downwards move whose effects are still being felt. Support is however provided within the lower range of the pennant by March's pin bar and the bullish inside bar from June 2010.
May was also a bearish reversal, but its high of 1.5606 was broken last month. Although last month closed up and its action was to the upside, it acted as a bearish pin bar, with this month seeing a sharp fall. The price is currently sitting right on the lower trend line:
The picture is very bearish and the down trend is strong. However we have arrived at and close to levels that may act as significant support:
1. The lower trend line of the pennant at 1.4870
2. The low of March's bullish pin bar at 1.4827
3. The low of the bullish inside bar from June 2010 at 1.4345
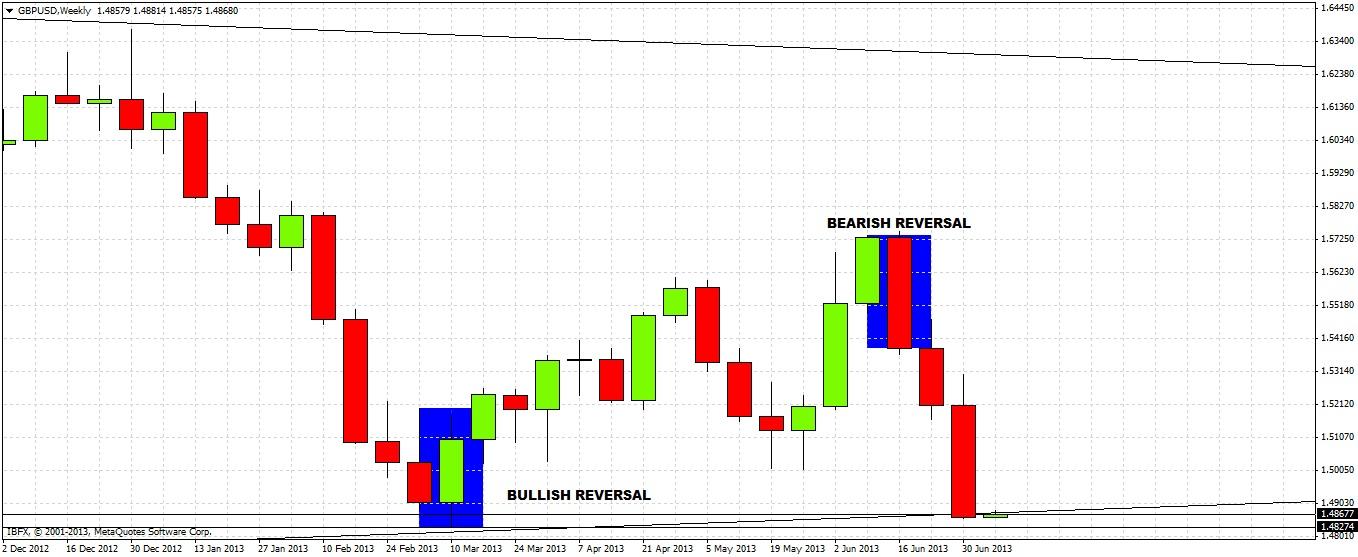
Taking a closer look through the weekly chart simply emphasizes the picture.
1. We have been in a strong down trend for the past three weeks beginning with a bearish reversal bar.
2. We are now within the zone where the previous bullish move started, with a bullish reversal bar.
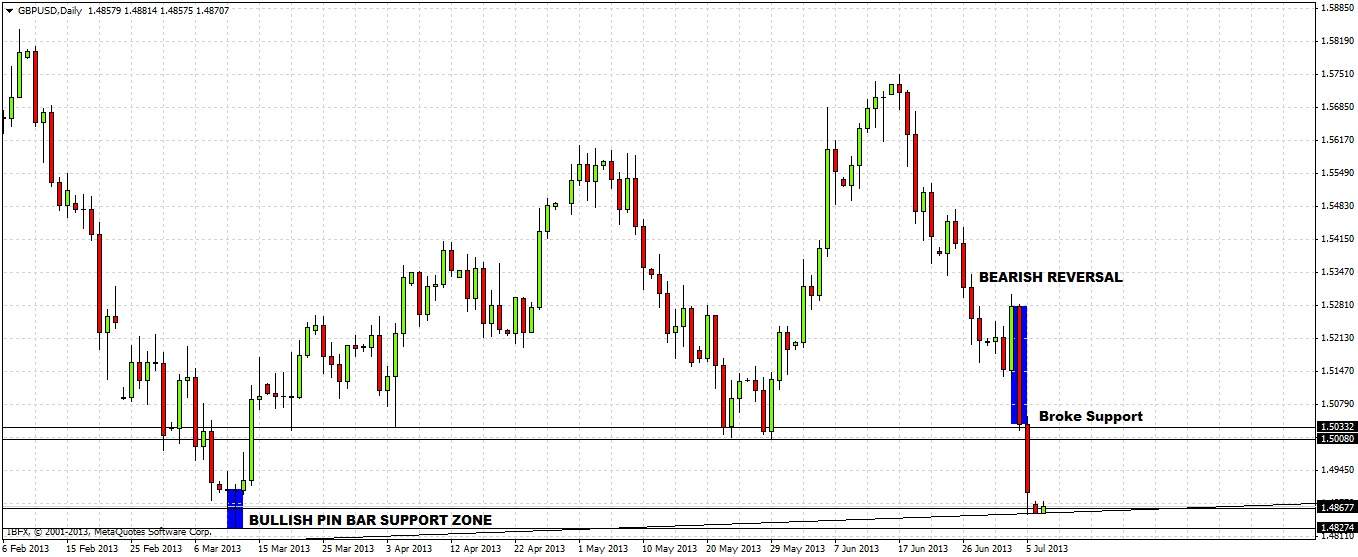
The daily chart shows more clearly the strength and violence of the down trend we are in right now. There was a strongly bearish reversal bar last Thursday, and on Friday the price cut through an established zone of support around 1.50. We are now in a zone of support established by a bullish pin bar on 12th March:
The overall picture is very bearish, with near-universally strong USD and weak GBP across the board compared to other currencies. The technical picture on the three time frames is also very bearish and the down trend has been strong, recently breaking through support quite easily. The downwards momentum is very strong.
However, we have reached a zone where the trend is likely to make some kind of pull back, although any reversal here would need time to get going. It is doubtful whether any bullish move would be able to break Friday's high of 1.5055 over the next two or even three days.
If the price breaks below 1.4830 decisively, we can expect the downwards move to continue, but it may slow down considerably as there was very bullish action the last time price was at this level.
It makes sense to wait for a pullback to around the 1.5026 level before considering a short, unless 1.4830 is broken decisively. With this type of established momentum, any longs within a retrace are apt to be risky.


